Demonstration with simulated data
Industrial IoT Demo Center
Explore energy, machine monitoring and OEE examples with a 3D factory to understand data and workflows before planning a project.
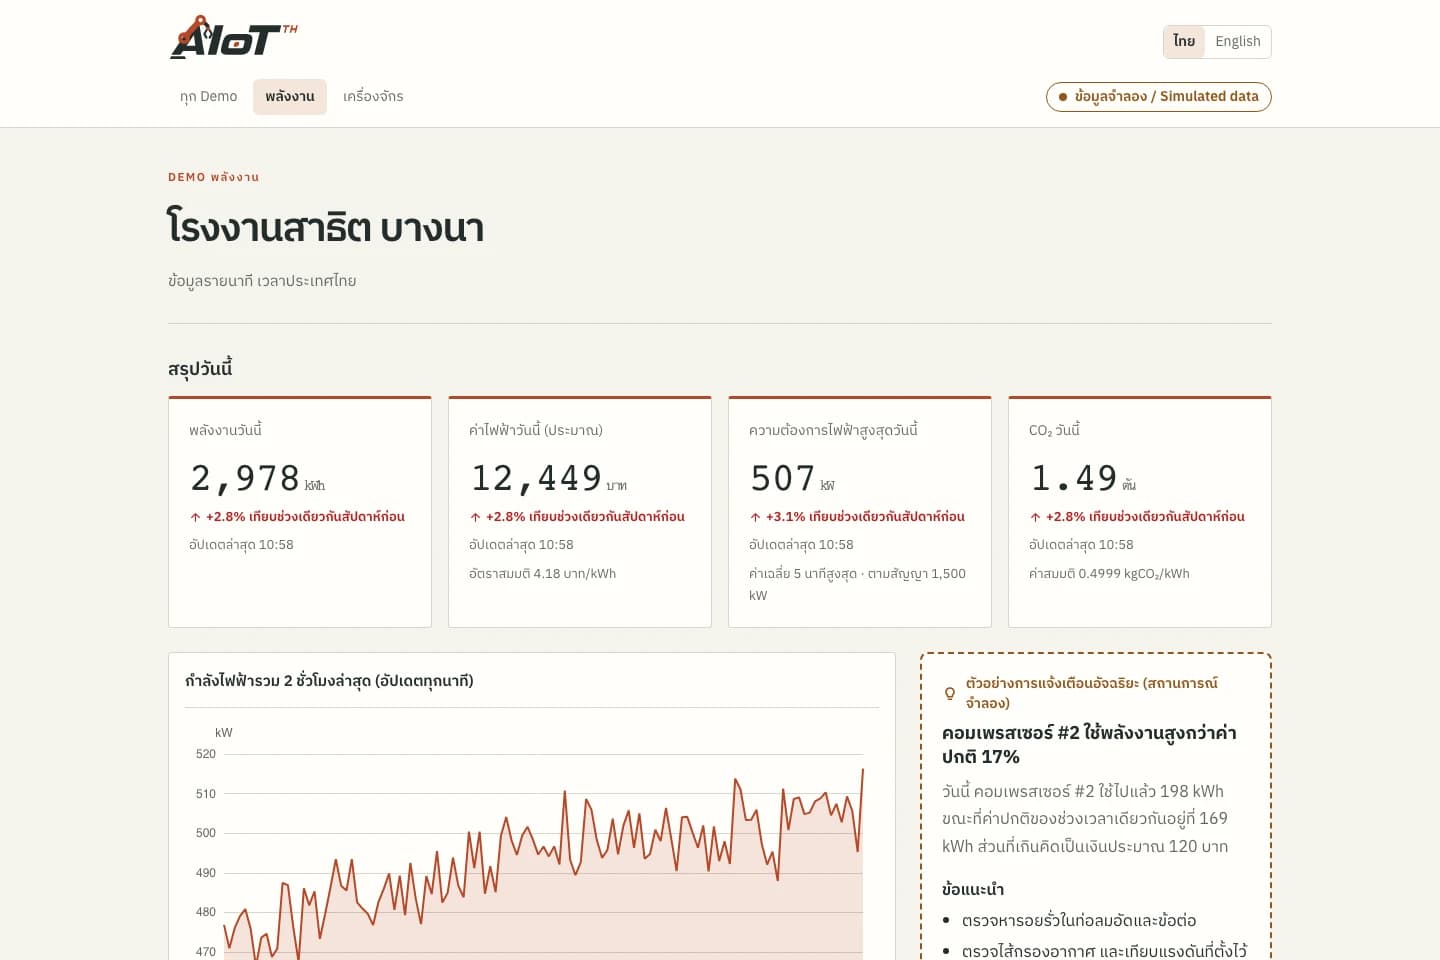
Operational workflows
- Explore energy and machine dashboards
- Understand OEE availability, performance and quality
- Try a 3D scene and compare example scenarios
DETAILS & PLANNING
Before opening Demo Center
Scope and data sources
The demo uses simulated readings and scenarios to explain the interface. Values and insights are not customer results or evidence of live device or AI integration. Use it to collect requirements before agreeing the system implementation scope.
- Explore energy and machine dashboards
- Understand OEE availability, performance and quality
- Try a 3D scene and compare example scenarios
Prepare for use at your own site
Check that your operational question matches the purpose of this system, then collect the relevant devices, data and access requirements. Examples demonstrate workflows; actual site adoption requires agreed integration and acceptance against reference data.
- Choose an energy, machine or production-performance workflow
- List the operational questions the dashboard should answer
- Identify capabilities to validate with actual data in a pilot
Questions about this topic
Does it use real or simulated data?
The demo uses simulated readings and scenarios to explain the interface. Values and insights are not customer results or evidence of live device or AI integration. Use it to collect requirements before agreeing the system implementation scope.
How can this be applied to my factory?
Share your existing equipment and requirements through the contact page. Devices, integration and acceptance are assessed for your site.