Products

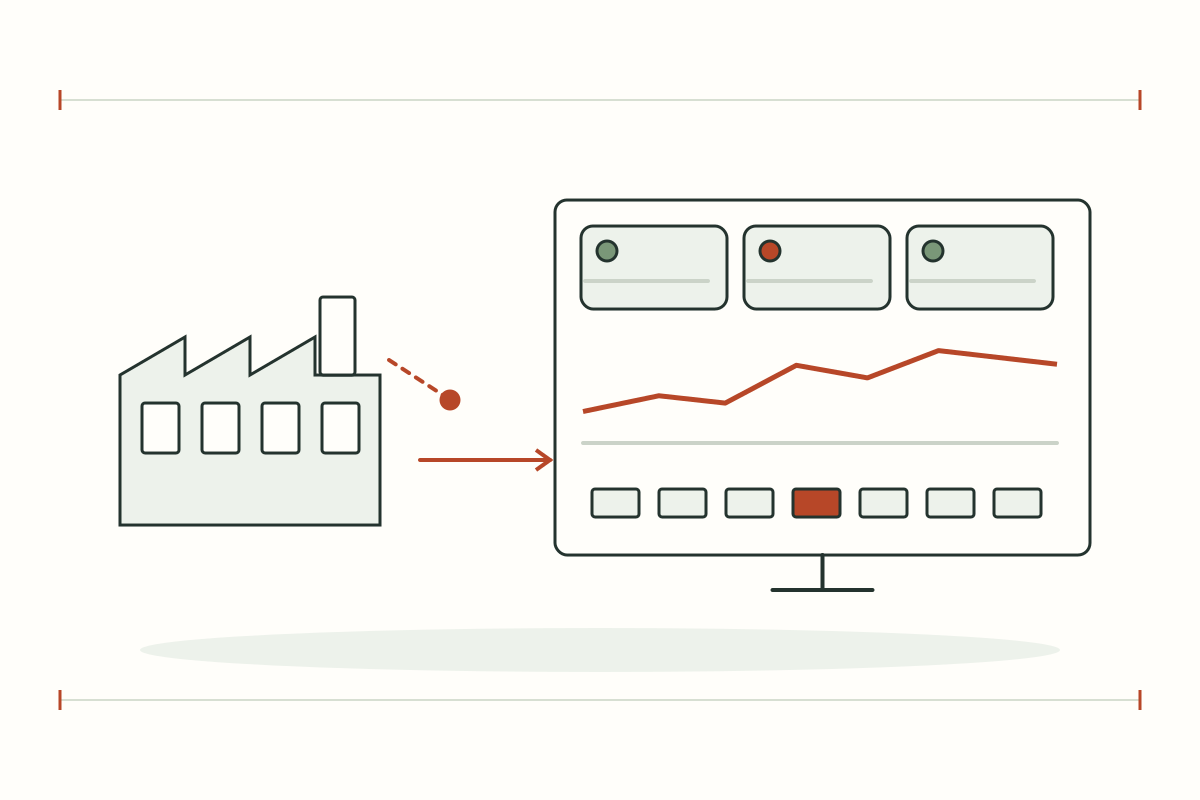
Factory devices and systems, from capture to production

LoRa, RFID, barcode scanners, SCADA, factory control, factory monitoring and OEE — choose devices, software or integration around your site.

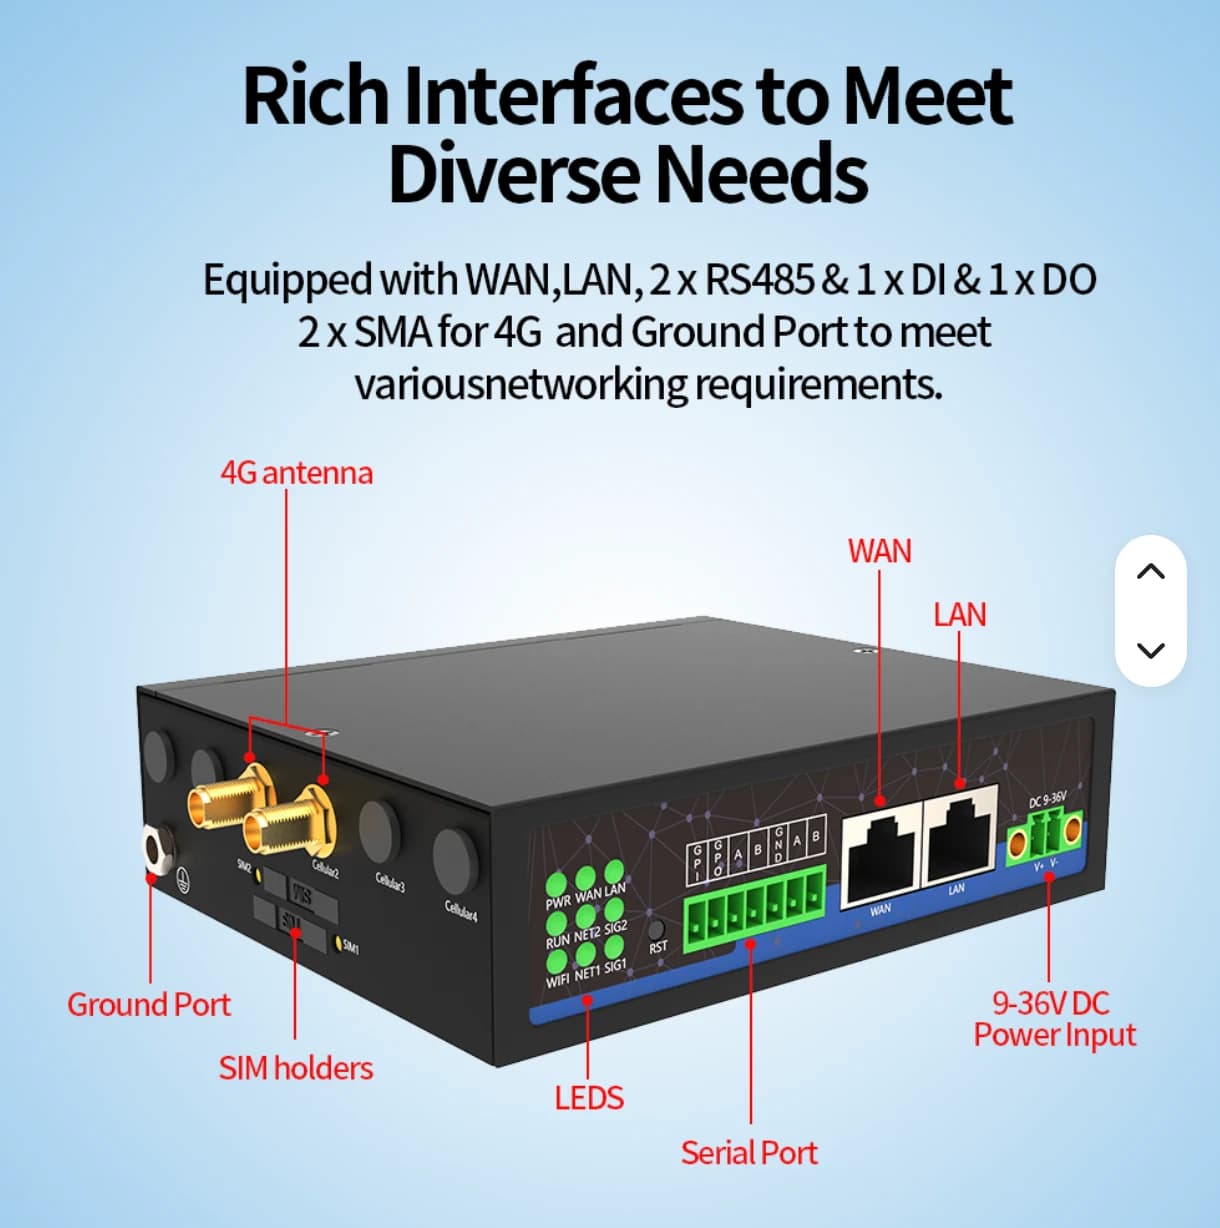
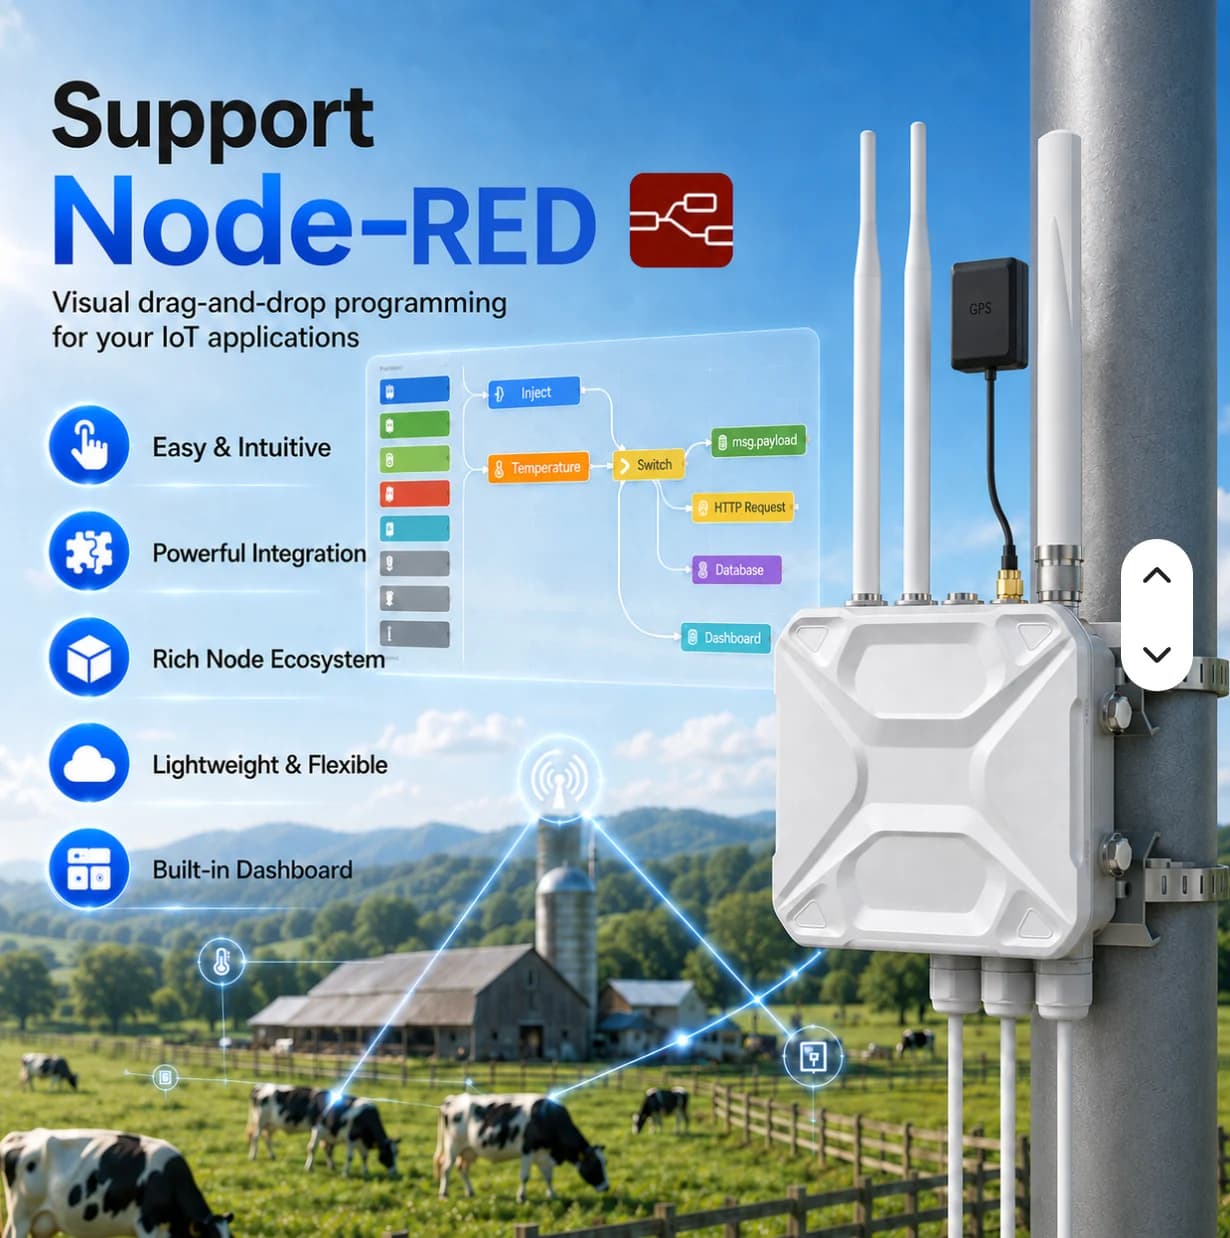
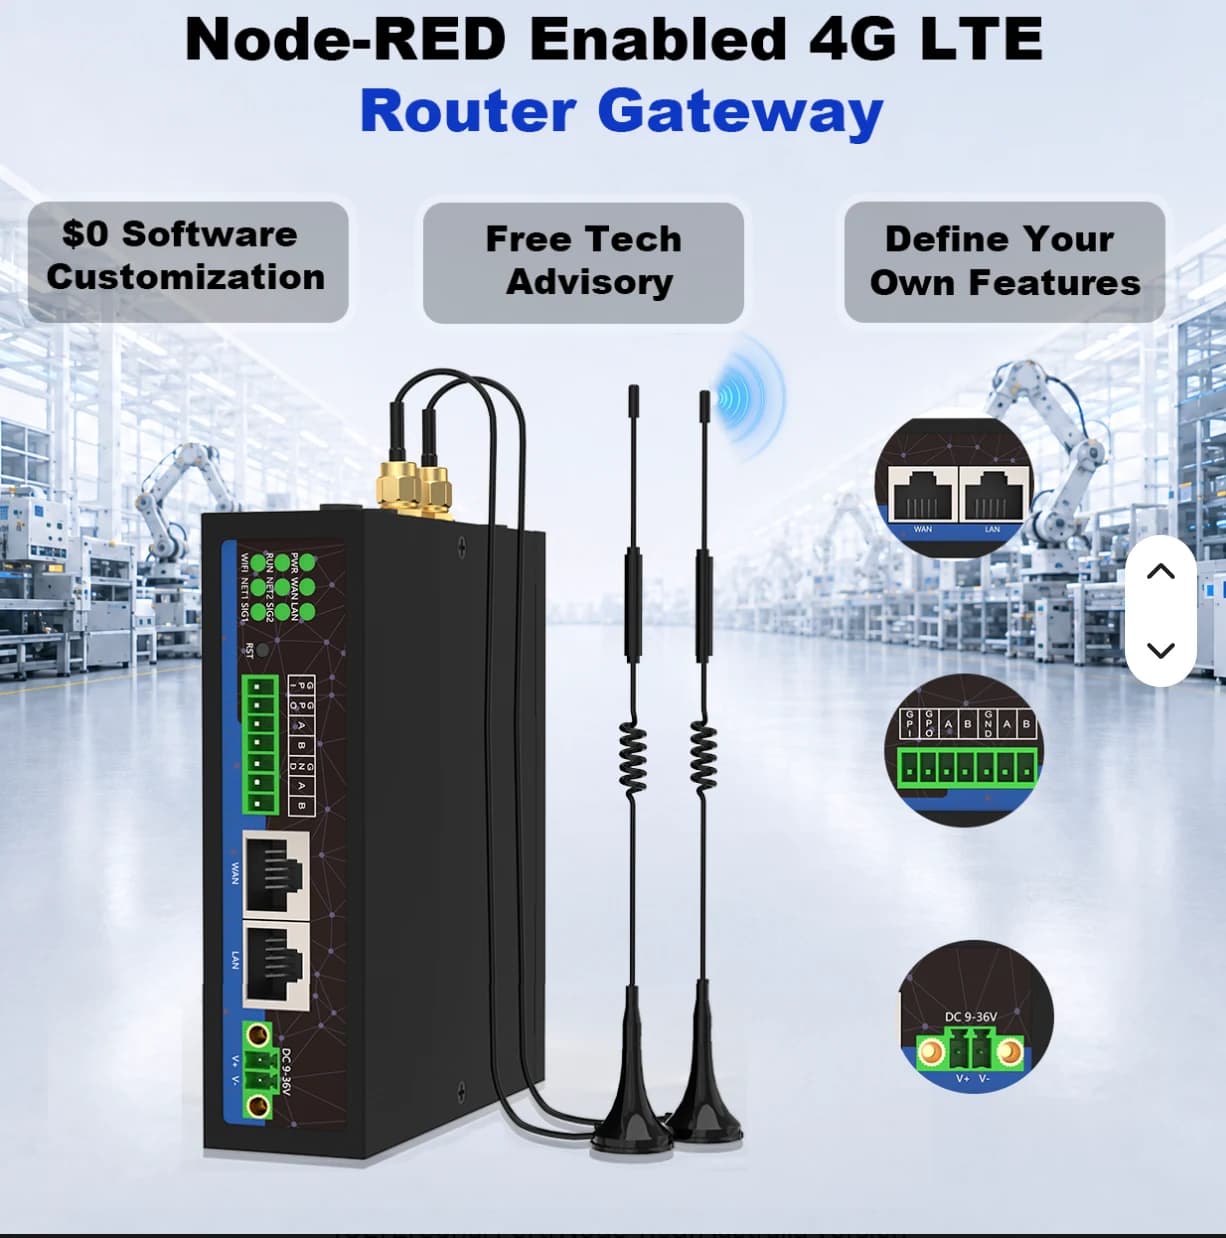
Supplier reference for Industrial 4G LTE Router with antennas

Products and systems across your factory

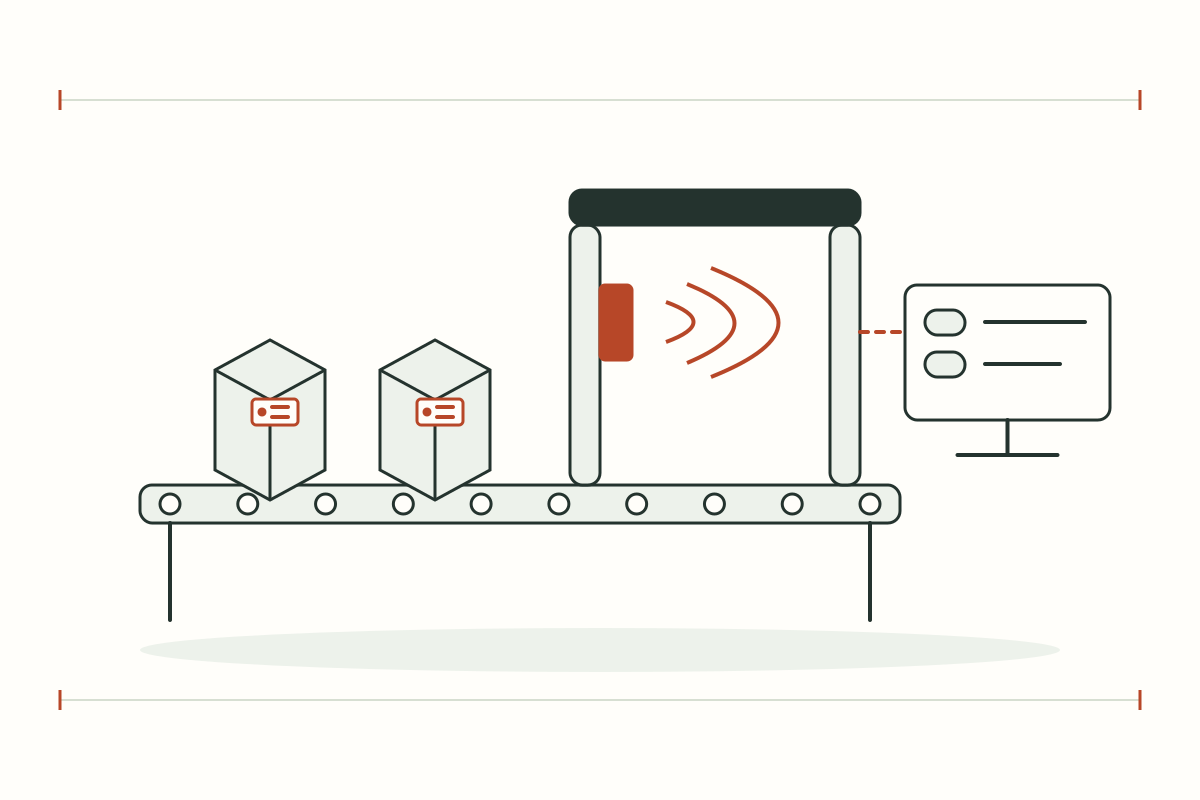
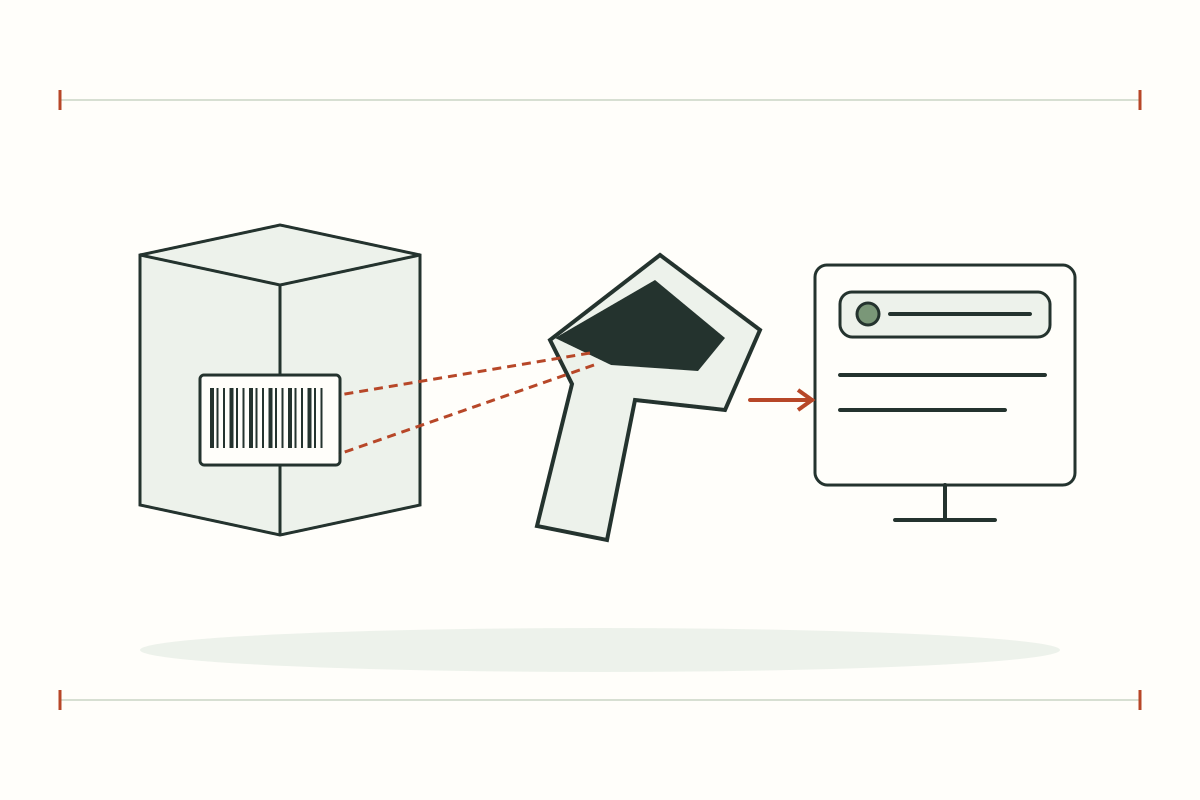
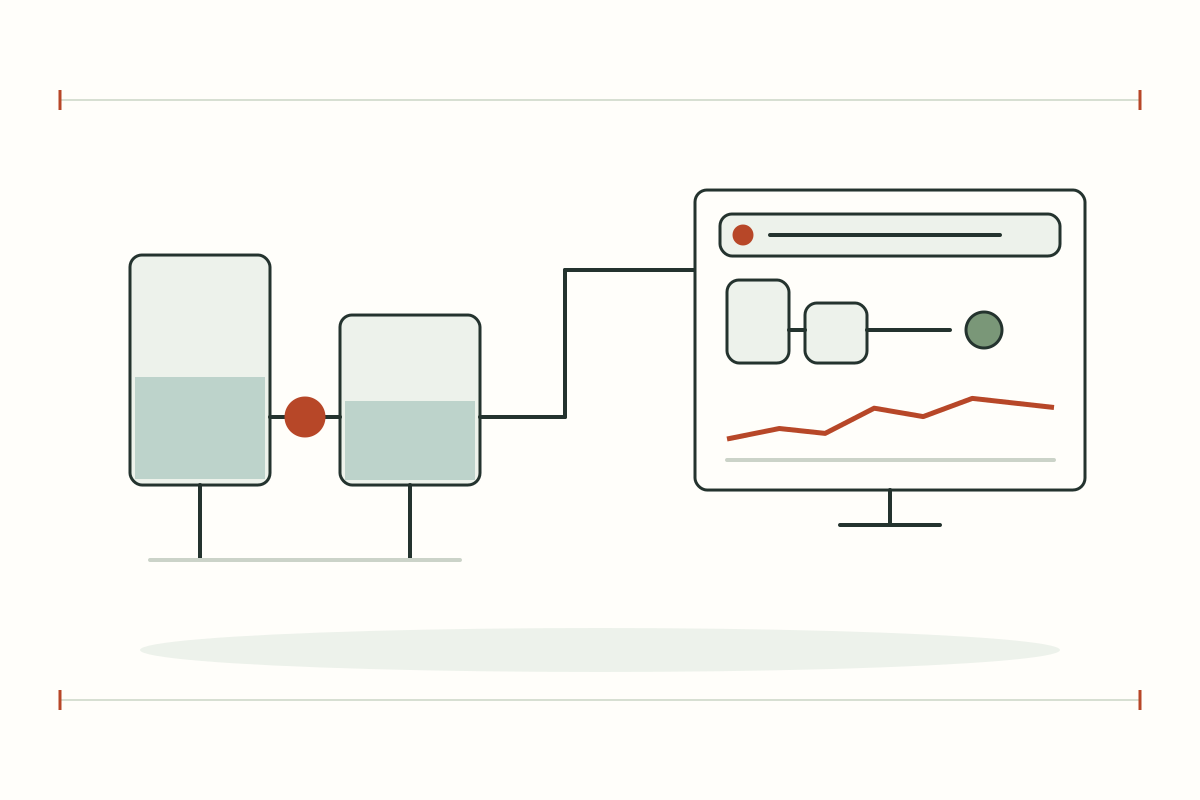
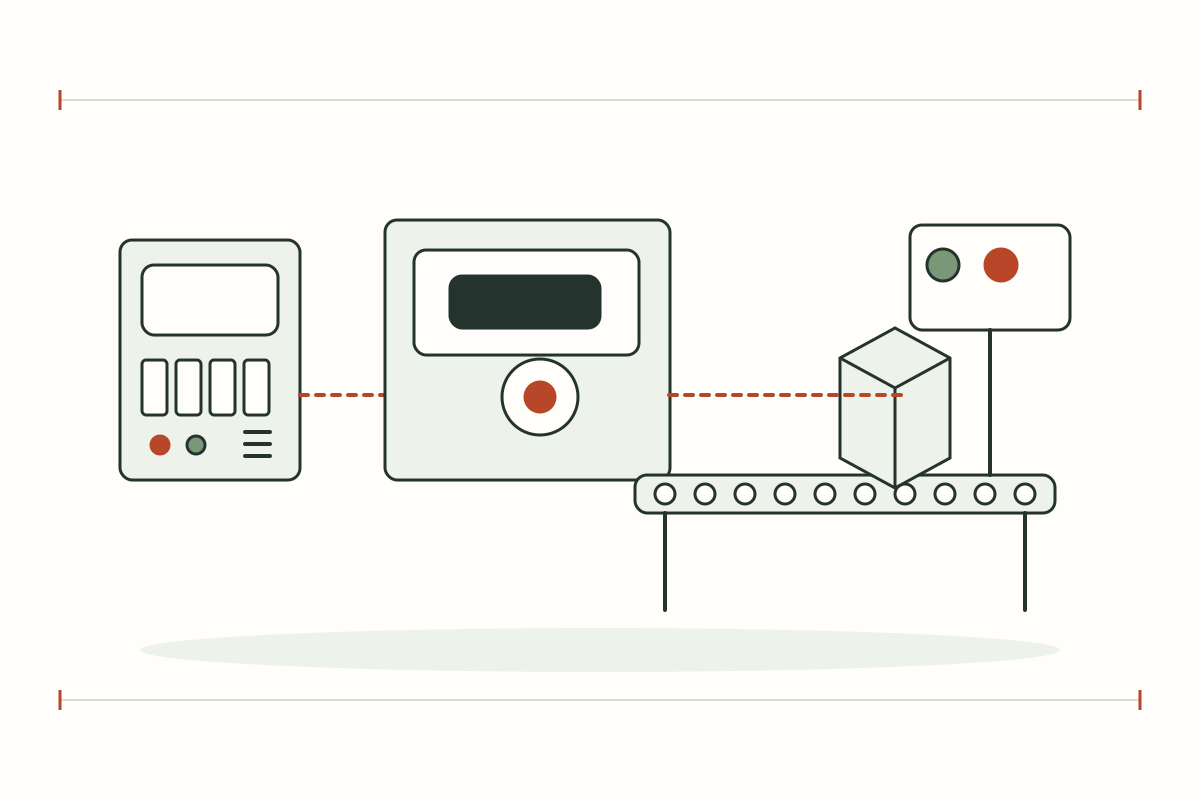
LoRa / LoRaWAN for wireless sensing; RFID and barcode for events; SCADA and factory control for processes; factory monitoring and OEE for production visibility.

Choose devices or an integrated system project. Device models, licences and integration scope are confirmed before quotation.

Choose a gateway for your site

Connect wired industrial equipment or collect wireless sensor data outdoors.

Supplier reference for Industrial 4G LTE Router with antennas

01 / WIRED / INDUSTRIAL

Industrial 4G LTE Router

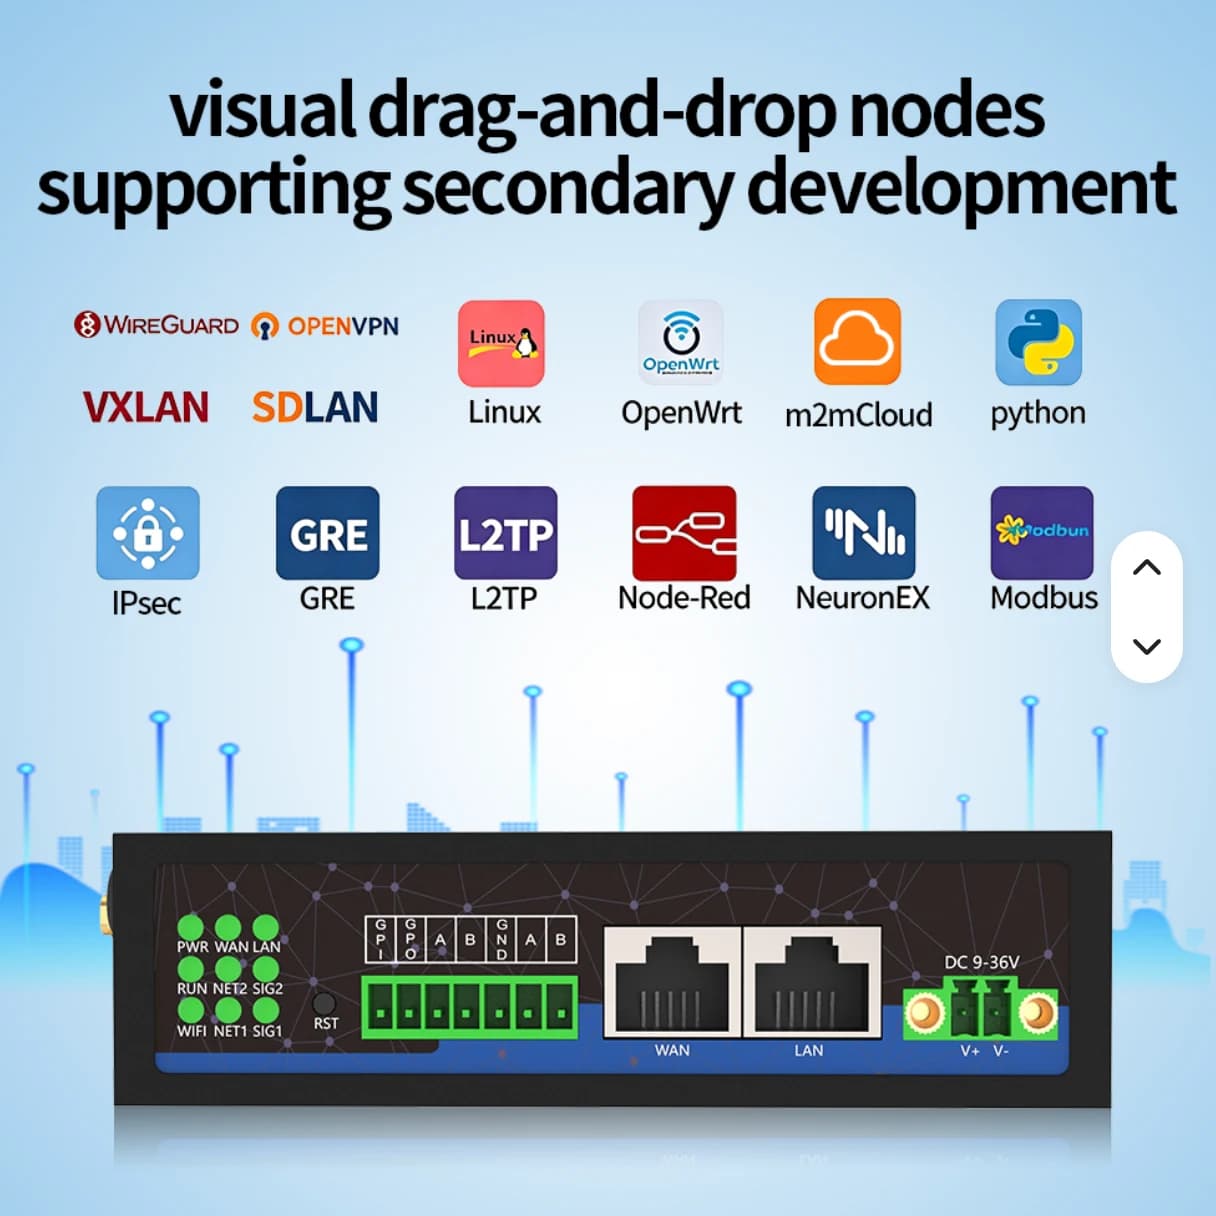
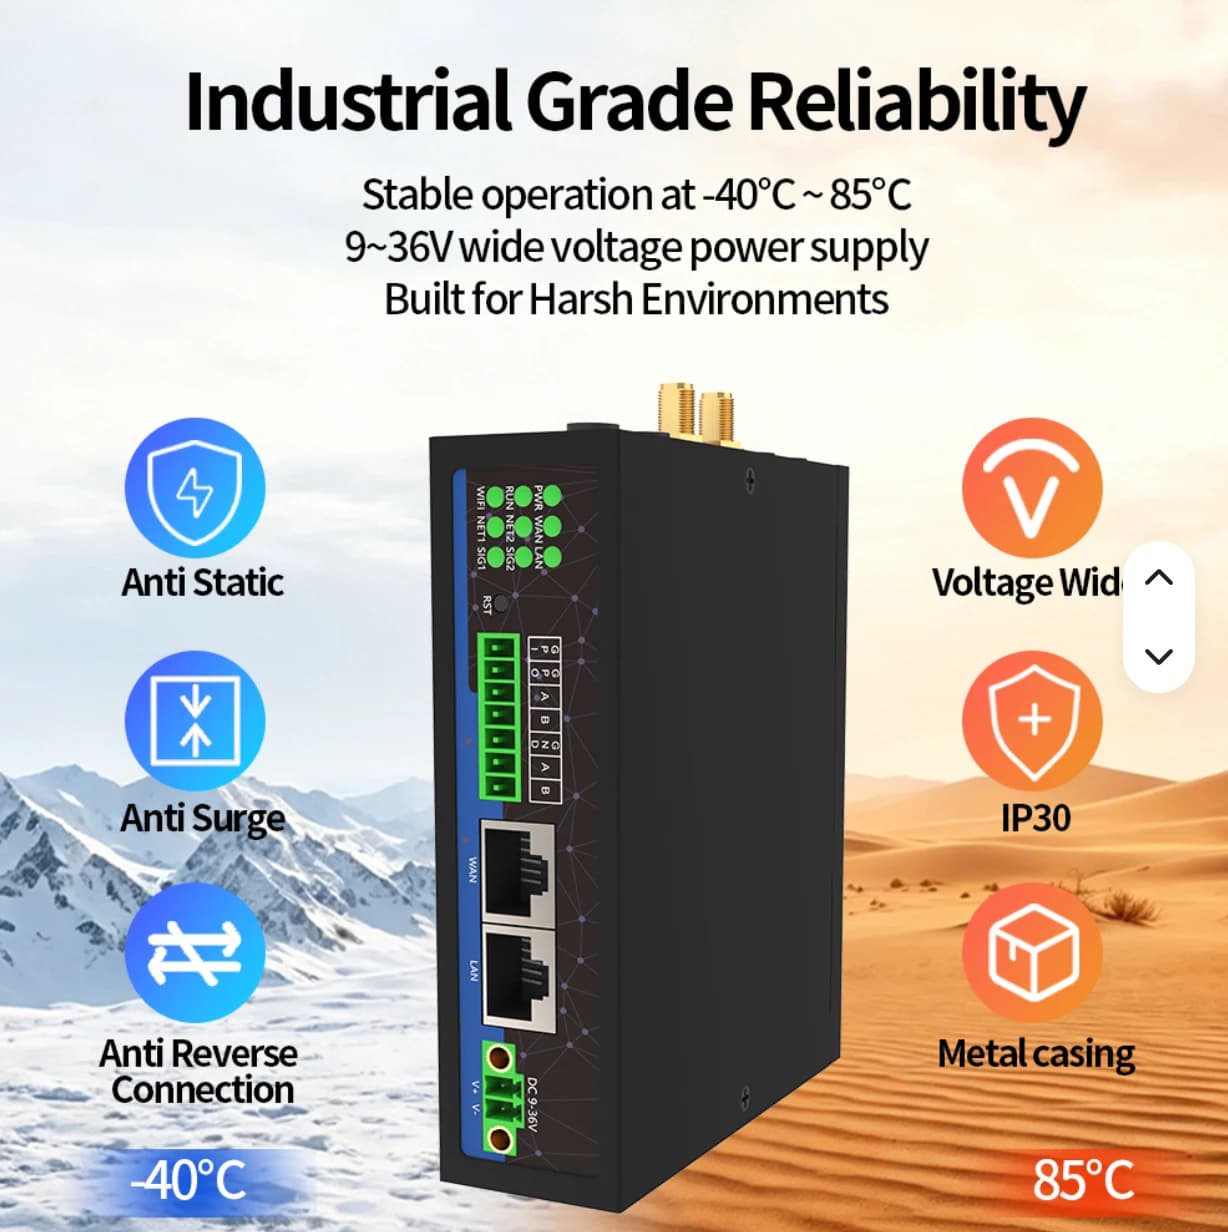
A gateway for control cabinets, PLCs and meters, with Ethernet, RS485, 4G LTE and Node-RED.

Interfaces
1 WAN + 1 LAN · 2 RS485
I/O
1 DI + 1 DO
Power
9–36 V DC
Software
Node-RED · Linux / OpenWrt · Python

For factories, electrical cabinets and wired measurement points.

DO is a hardware capability. AIoT TH Phase 1 reads data; device control and optional software require a separate project scope.

Product and installation detailsEnquire about this product
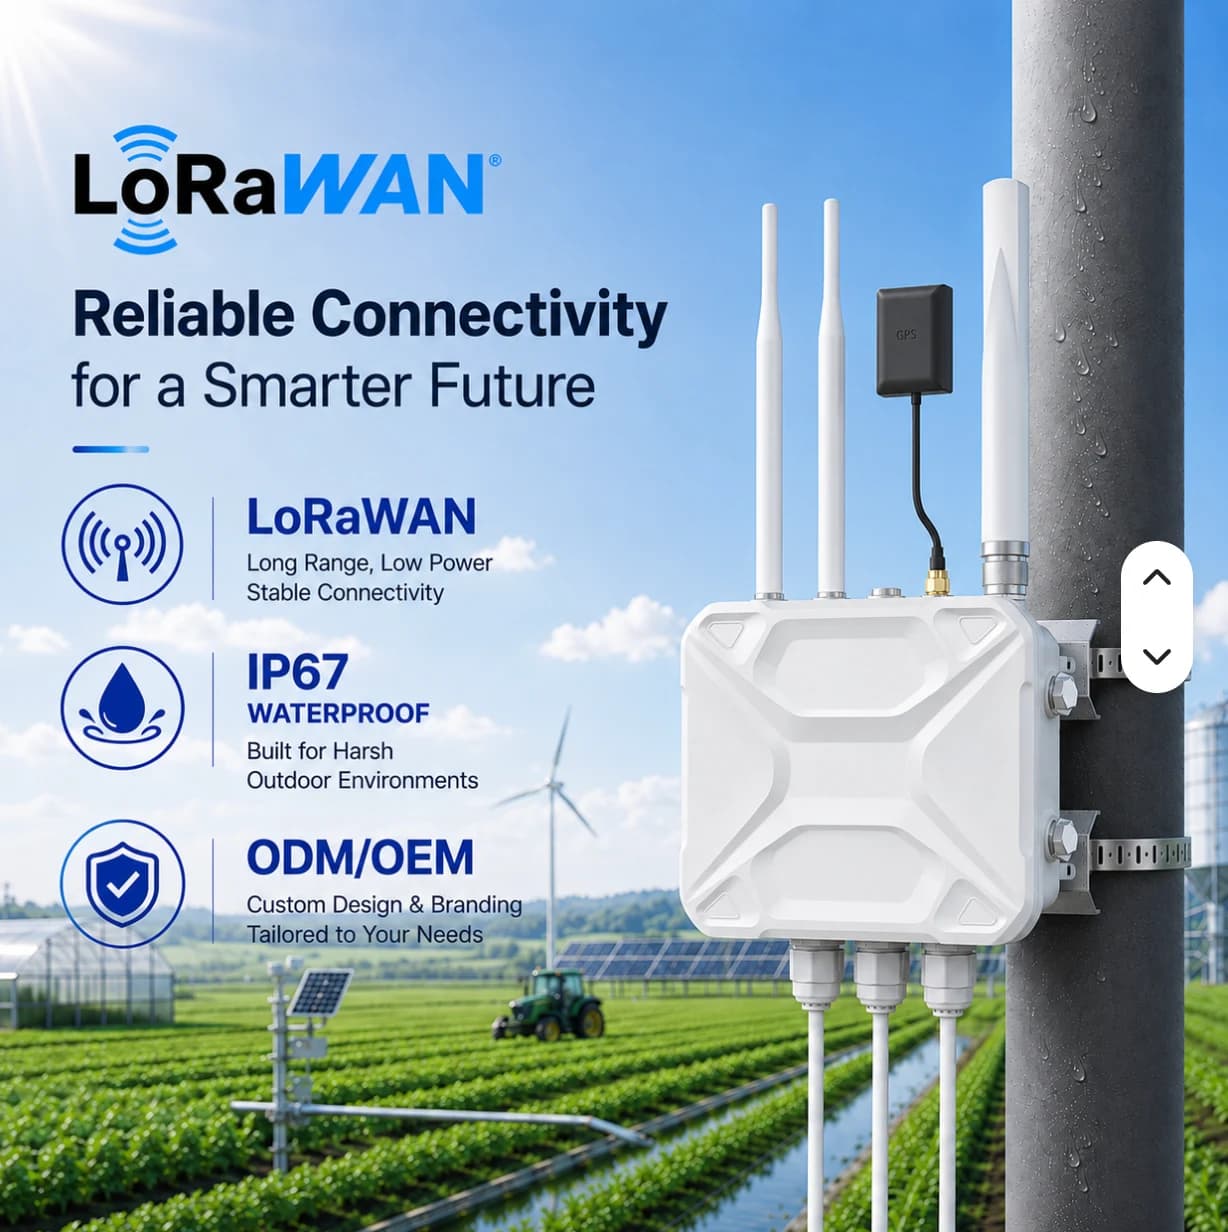
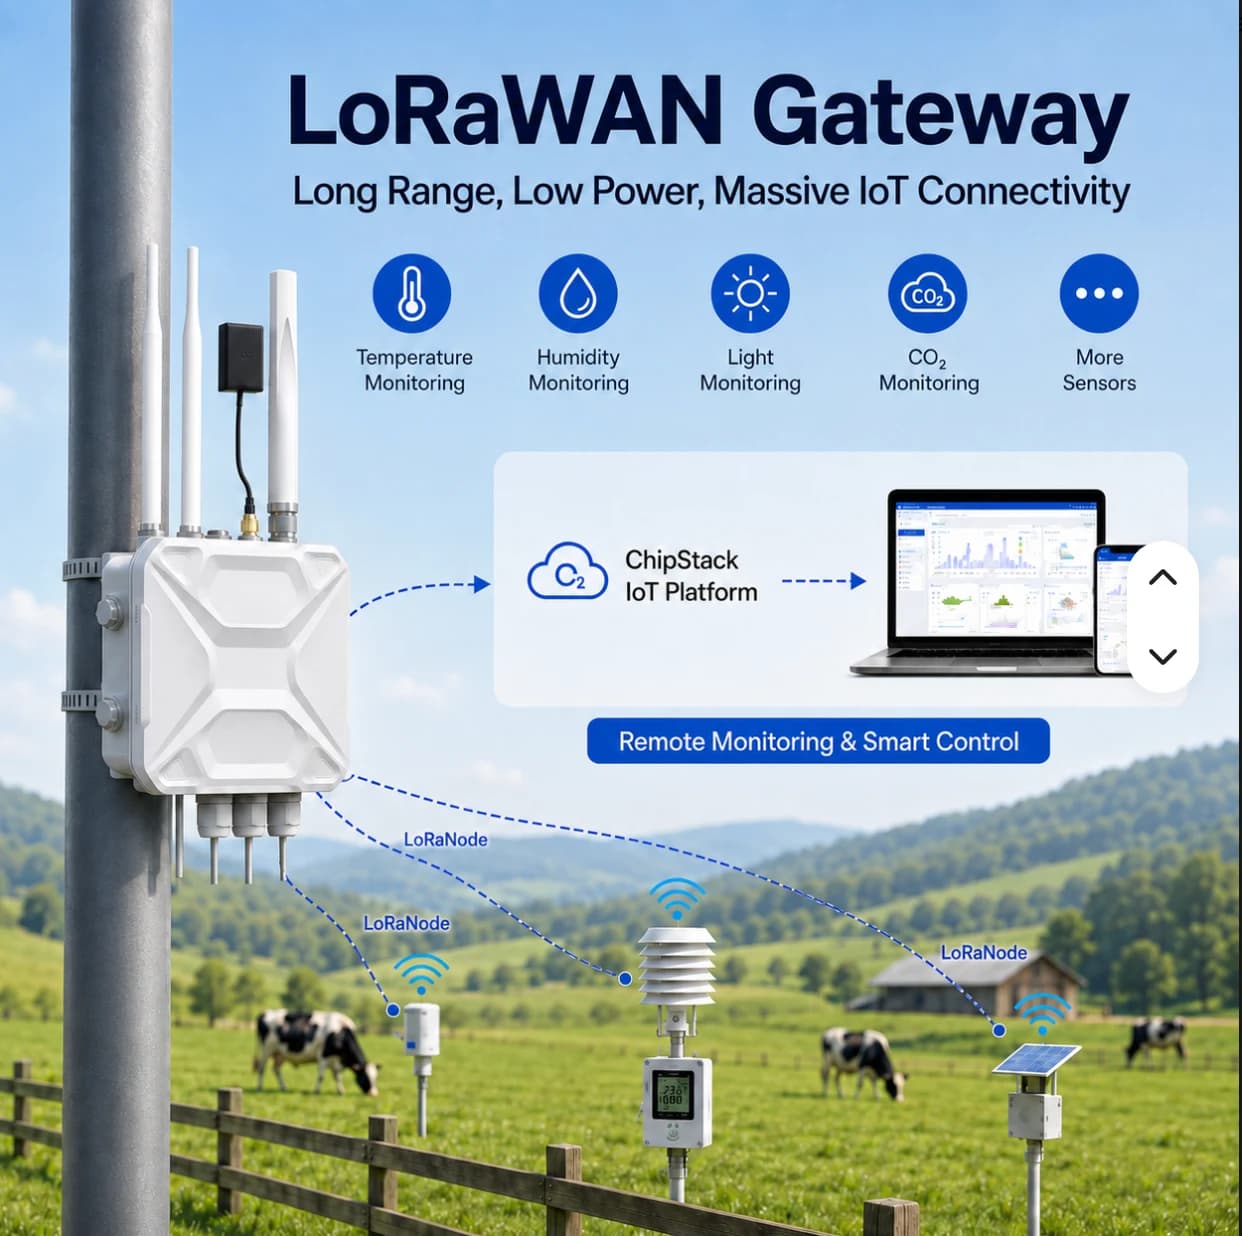
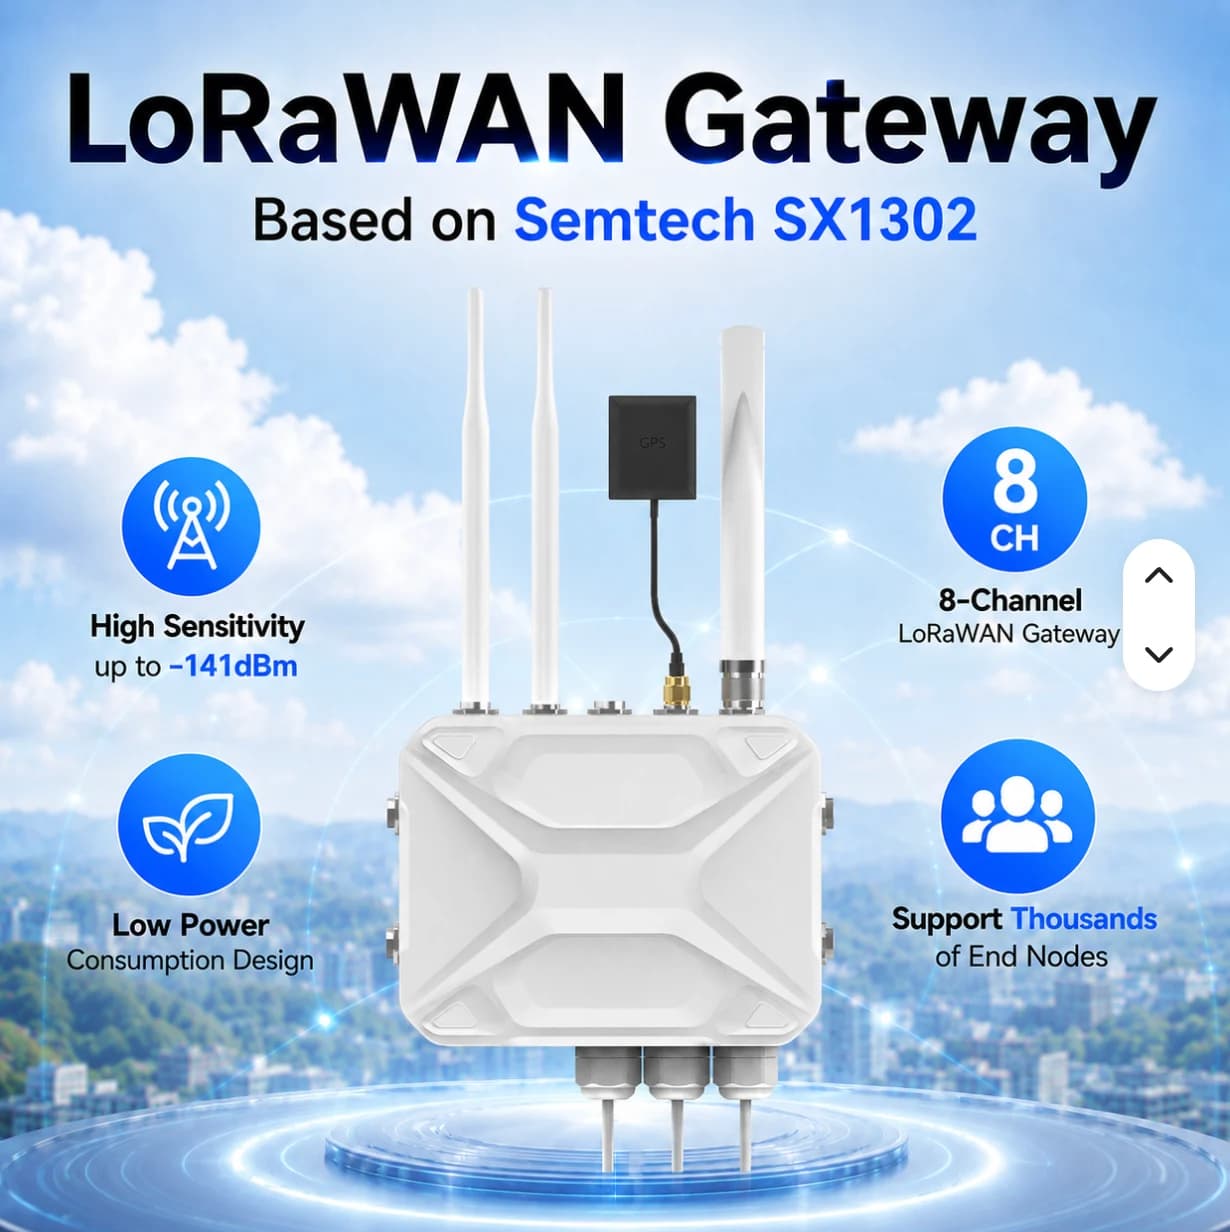
Supplier reference for outdoor LoRaWAN gateway with antennas and GPS

02 / WIRELESS / OUTDOOR

Outdoor LoRaWAN Gateway

Aggregate LoRaWAN sensor data across outdoor sites. A pole-mounted enclosure for agriculture, buildings and utilities.

Chipset
Semtech SX1302
Channels
8-channel LoRaWAN
Enclosure
IP67 · Outdoor
Development
Node-RED · Python

For distributed sensors and sites where cabling is difficult.

Confirm the selected frequency variant, network server and platform integration for each project.

Product and installation detailsEnquire about this product

Details are based on supplier reference images. Confirm the model, specifications, included accessories and AIoT TH Cloud integration before quotation.

AIoT TH Cloud

A monthly service per site. Choose a package by the number of gateways, data points and how long you need to keep data.

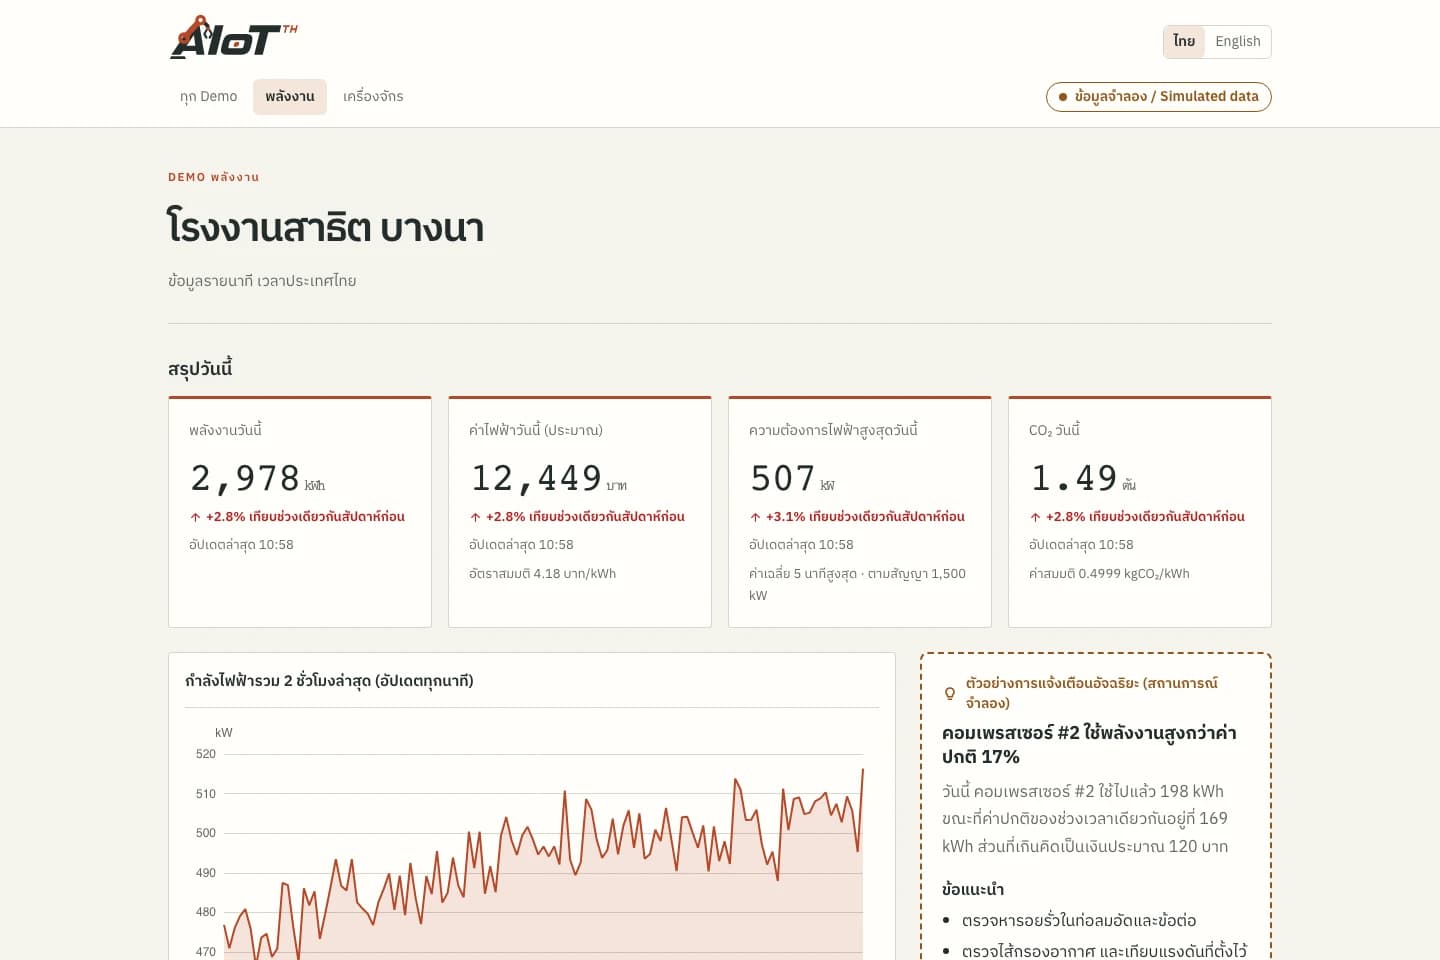
ENERGY MONITORING / DEMO
Energy demo dashboard with consumption charts and simulated factory data
Actual demo screenshot · Simulated data Open the energy demo →
  • Dashboards with latest values and history charts, on desktop and mobile
  • Alerts for out-of-range values and lost connections, via LINE and email
  • 30 days of detailed data, plus summarised history by package
  • Many sites in one account, with a package chosen per site

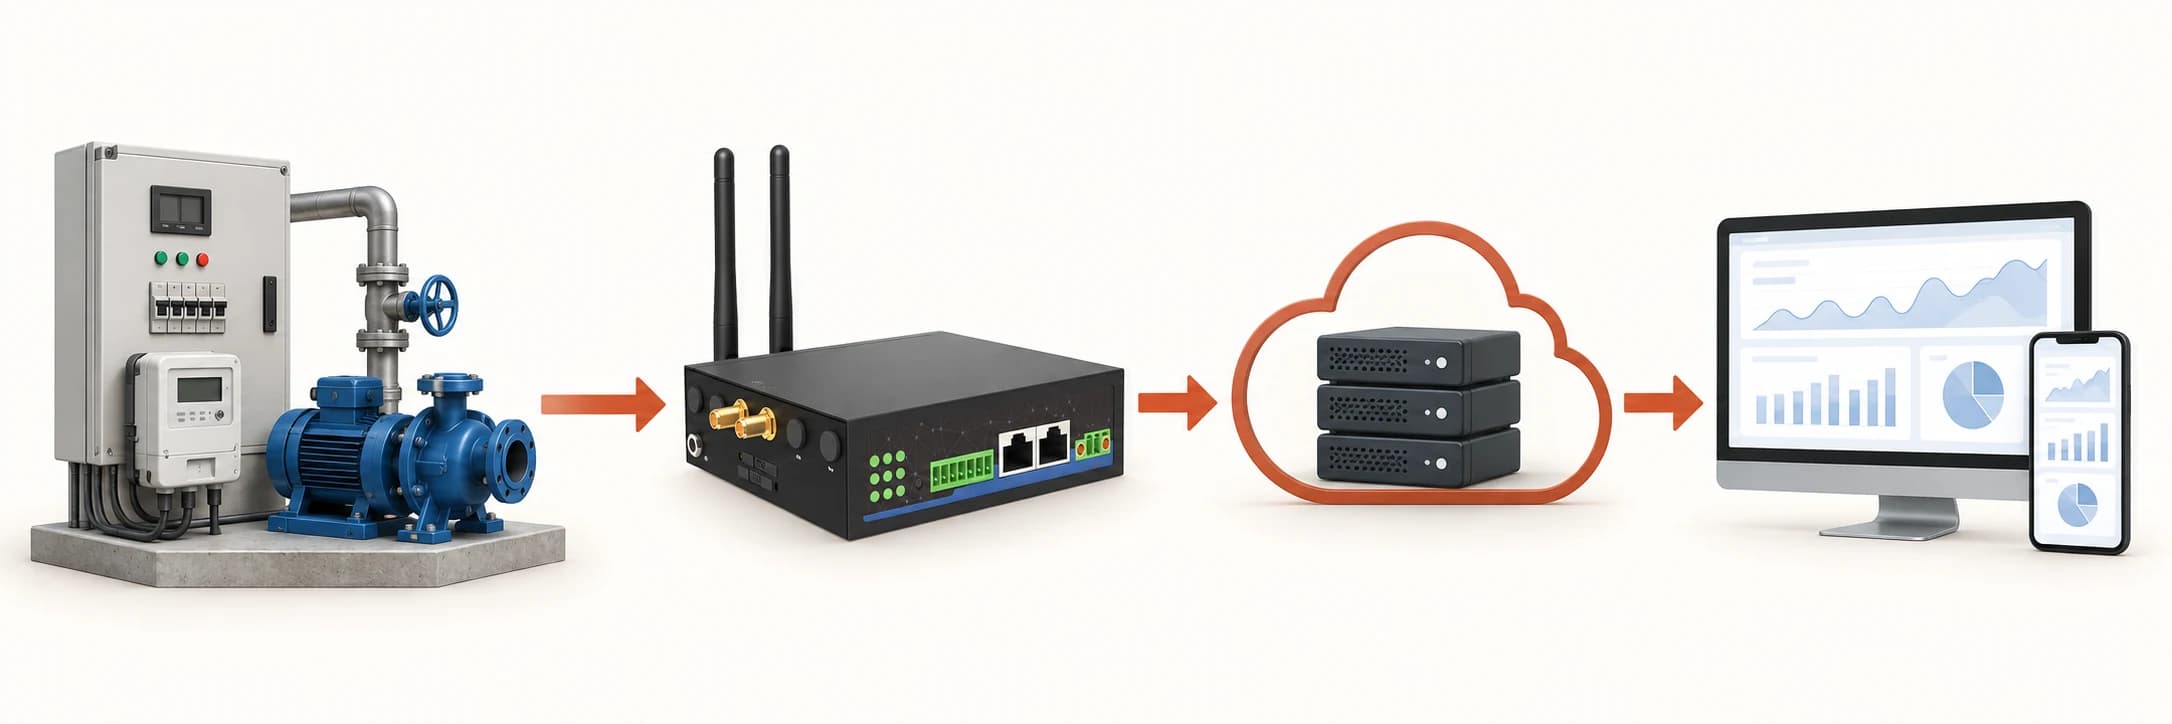
How your data flows

Data moves from field equipment through a gateway and cloud to dashboards

Scroll to explore the connection path →

  1. PLC / Sensor / RFID / Barcode

    Read values or capture events via Modbus, DI, LoRaWAN or reader and scanner interfaces.

  2. AIoT Gateway

    Reads your devices and buffers data on the device when the connection drops

  3. 4G

    Sends data over cellular or internet, encrypted with TLS

  4. AIoT TH Cloud

    Stores time-series data, isolated per organization

  5. Dashboard • Alerts • AI (in development)

    Dashboards and alerts form the core. SCADA, OEE and control integration are designed per project. AI is in development and not available yet.

  6. ERP / MES / API

    Passes data on to your other business systems through the API

FACTORY APPLICATIONS

From a site problem to a practical system

Illustrative system designs with equipment, data, responsible teams and project conditions. These are not customer case studies.

DIGITAL TWIN · SIMULATED

Simulated digital twin: site, equipment and events in one view

This simulated digital twin is a model running in your browser. It does not mirror a PLC or customer site and does not control equipment.

Simulated data · No equipment connected
Factory monitoring · 3D DIGITAL TWINDrag to orbit · Scroll or pinch to zoom
Loading 3D map…

Live (simulated) · 08:00:00

Illustrative 3D layout, not surveyed coordinates. Scene labels show values from the simulated twin. Select equipment on the scene or in the twin tree.

Total power62.0 kW
M-02 temperature46.0 °C
M-02 vibration2.10 mm/s

WHAT-IF · SIMULATED

Current plan vs alternative · next 30 simulated minutes

Current plan

M-01 running

Energy over 30 min
31.1 kWh
Peak power
64.7 kW

Alternative

M-01 stopped

Energy over 30 min
17.4 kWh
Peak power
36.2 kW
Total power (kW)

Computed from the browser simulation to compare choices; not a prediction for a real site.

Inspection and command history

Select a scene device, then inspect or control it

Data path

PLC / Meter → Modbus TCP / RS485 → Gateway → MQTT TLS :8883 → Monitor

CCTV uses IP over PoE / NVR independently of LoRaWAN. This scene is illustrative and has no live video.

Operator view

Connect power readings and machine states to site locations for maintenance inspection.

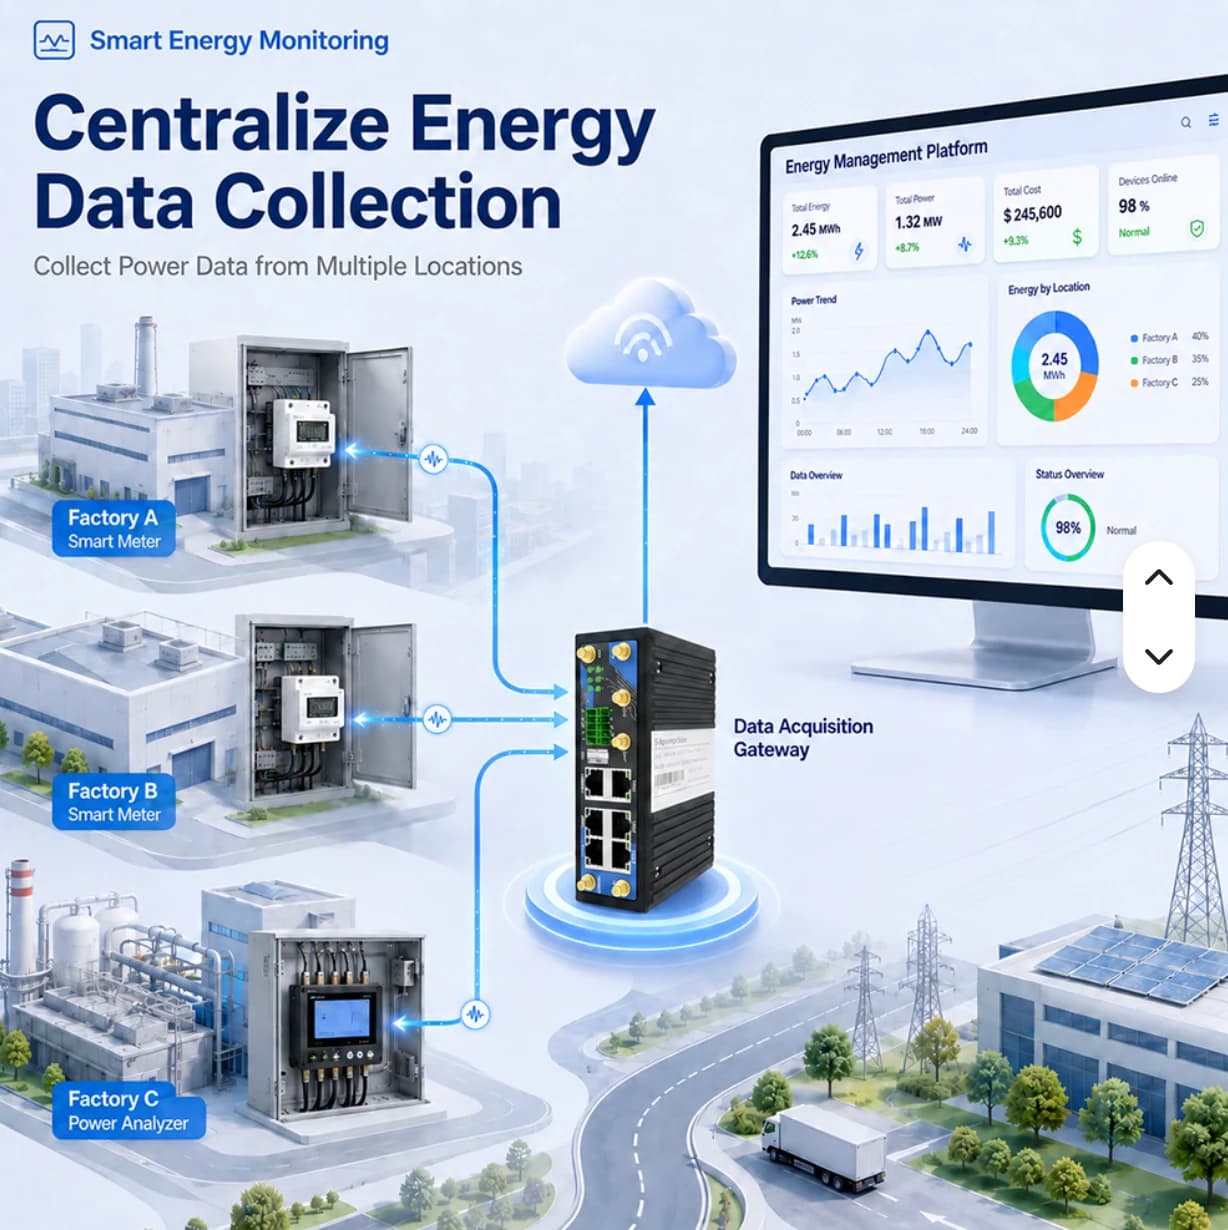
Supplier illustration of energy data collection across factories

Understand where and when the factory uses energy

Move from a monthly total to area-level meter readings that engineering teams can use to investigate loads and plan improvements.

Factories with multiple circuits or buildings that need separate energy readings

Explore problems, solutions and workflow
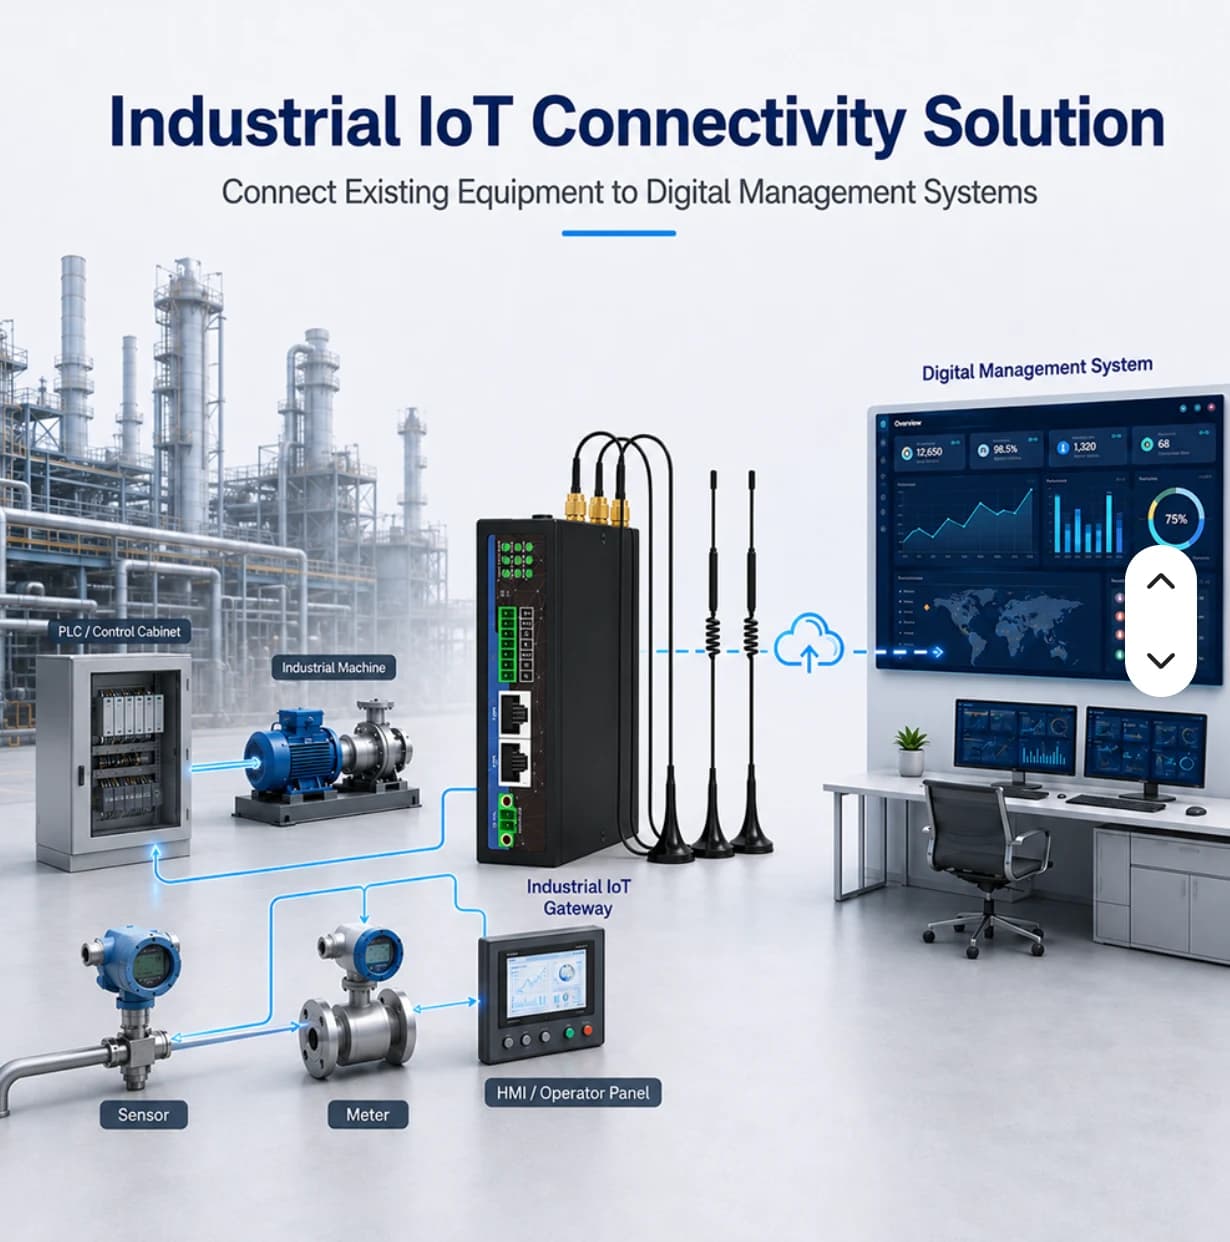
Supplier illustration of industrial equipment connected through a gateway

See machine states and investigate events with history

Connect PLC or sensor signals so production and maintenance use the same observations before developing performance analytics.

Factories with readable PLC values or accessible state signals

Explore problems, solutions and workflow
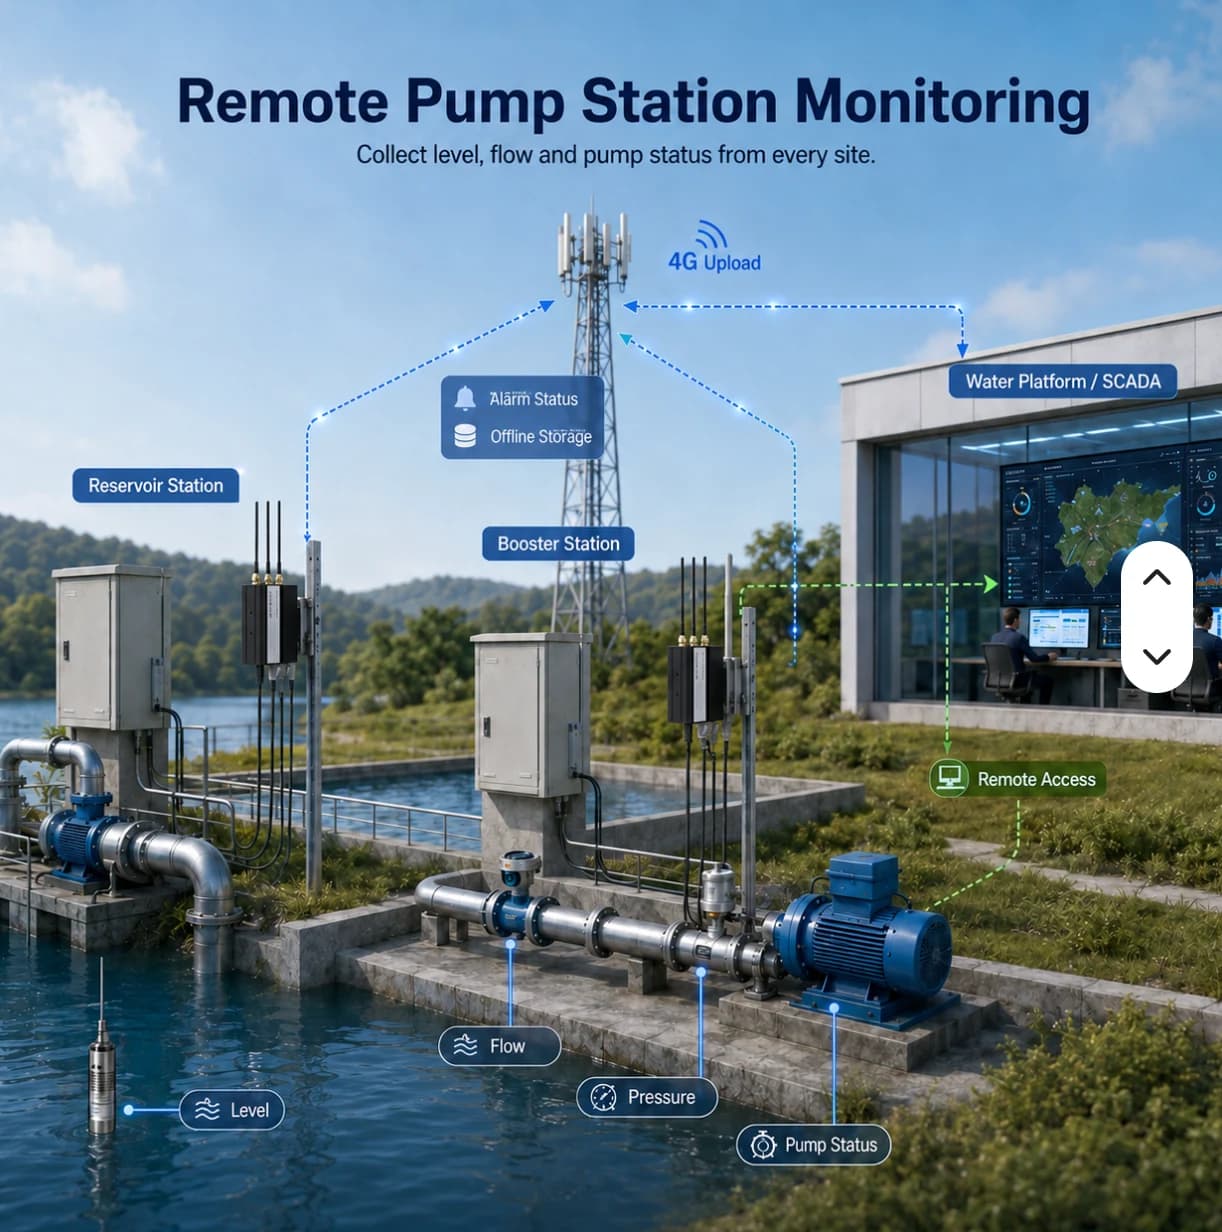
Supplier illustration of remote water-level, flow and pump monitoring

Monitor pumps, tanks and distributed measurement points

Give teams the latest readings, update times and connectivity context before deciding which location needs an on-site check.

Factories with distributed tanks, pumps or utility systems

Explore problems, solutions and workflow

DETAILS & PLANNING

Select products that work together

Choose the gateway by its data interface

Evaluate an industrial router for equipment with Ethernet or RS485 interfaces. Distributed LoRaWAN sensors need a different gateway family. In both cases, verify the full path to the cloud rather than selecting hardware by its appearance or antenna count.

  • Wired PLCs and meters: check register maps and port counts
  • Wireless sensors: check frequency variants and payload decoders
  • Uplink: confirm network access and destination data format

Separate the quotation into clear components

Hardware, accessories, installation and cloud subscriptions are separate components. Itemizing them makes initial costs, recurring charges and responsibilities easier to understand, including any additional integration development.

  • Device, antennas, power supply and mounting accessories
  • Cabling, configuration, testing and handover documentation
  • Per-site package, SIM charges and additional integration

Select products for the workflow

LoRa / LoRaWAN for wireless sensors, RFID and barcode for identifiers and events, SCADA for process supervision, factory control for automation, factory monitoring for readings, and OEE for production performance.

  • Match protocols and interfaces to actual equipment
  • Define readings, states, events and calculations before design
  • Validate on site and confirm scope before operational use

Review each system’s scope before opening it or using the example to plan your project.

Questions about this topic

Are the two gateway families interchangeable?

Not directly. An RS485 router connects wired equipment, while a LoRaWAN gateway receives wireless sensor packets. Choose according to the field devices and integration requirements.

Are final prices and variants listed?

The catalog describes product families and reference specifications. Exact variants, included accessories and prices must be confirmed in the project quotation.