Current plan
M-01 running
- Energy over 30 min
- 31.1 kWh
- Peak power
- 64.7 kW
Solutions
Every solution runs on the same gateway and cloud; what changes is the equipment we read and the dashboards you see. Start with one site and add more one at a time.
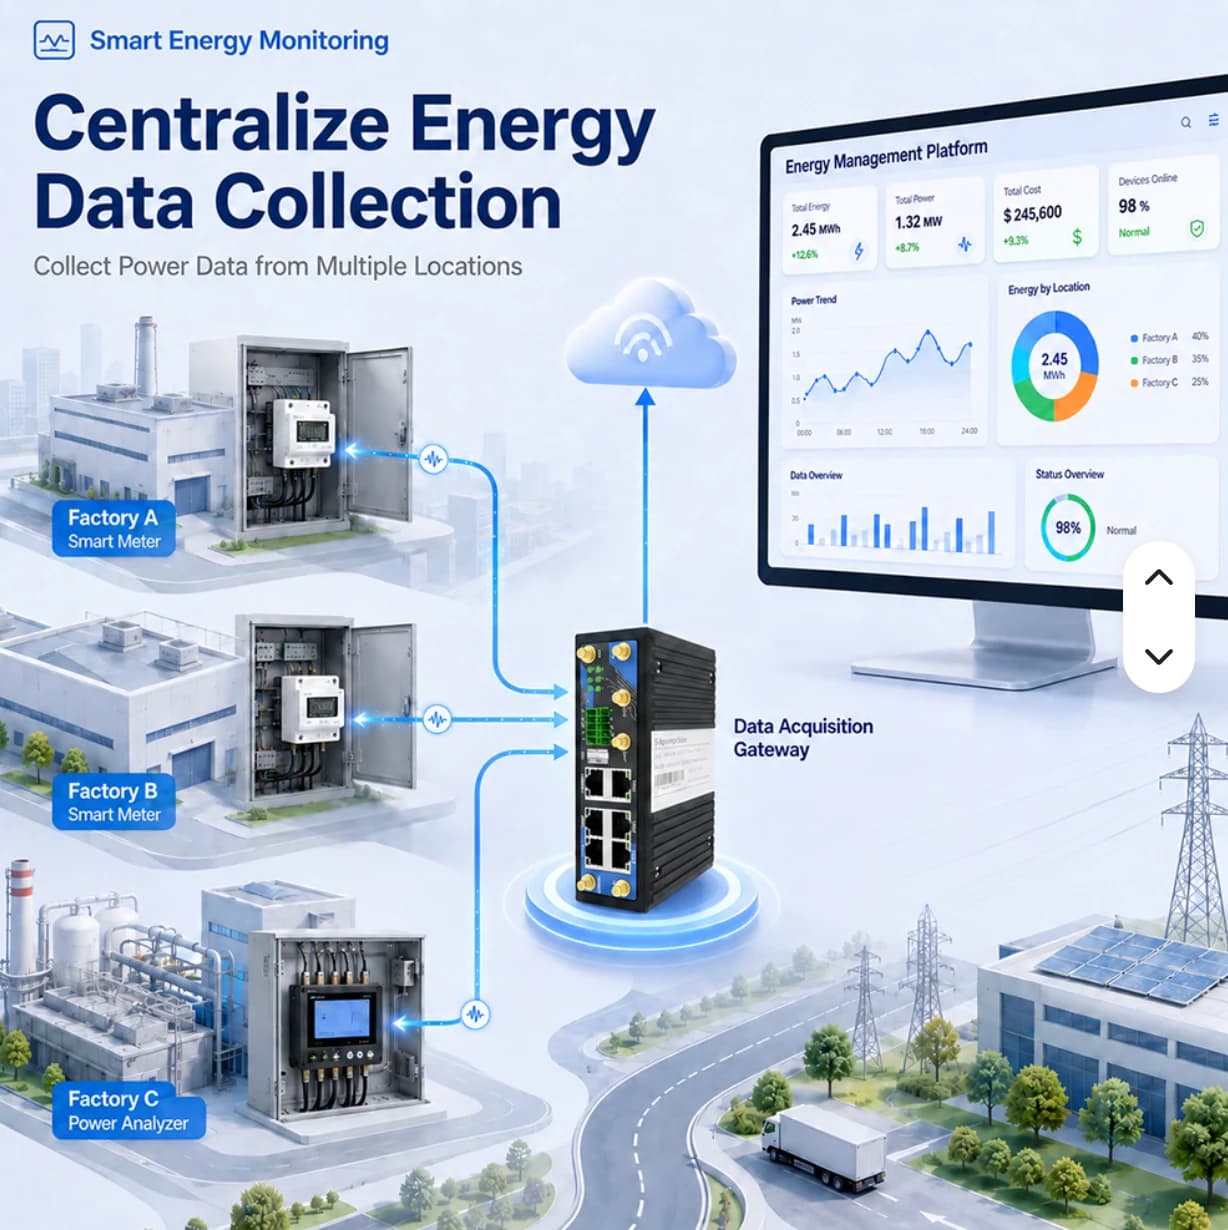
Energy Monitoring
See meter readings at the points that matter.
Learn more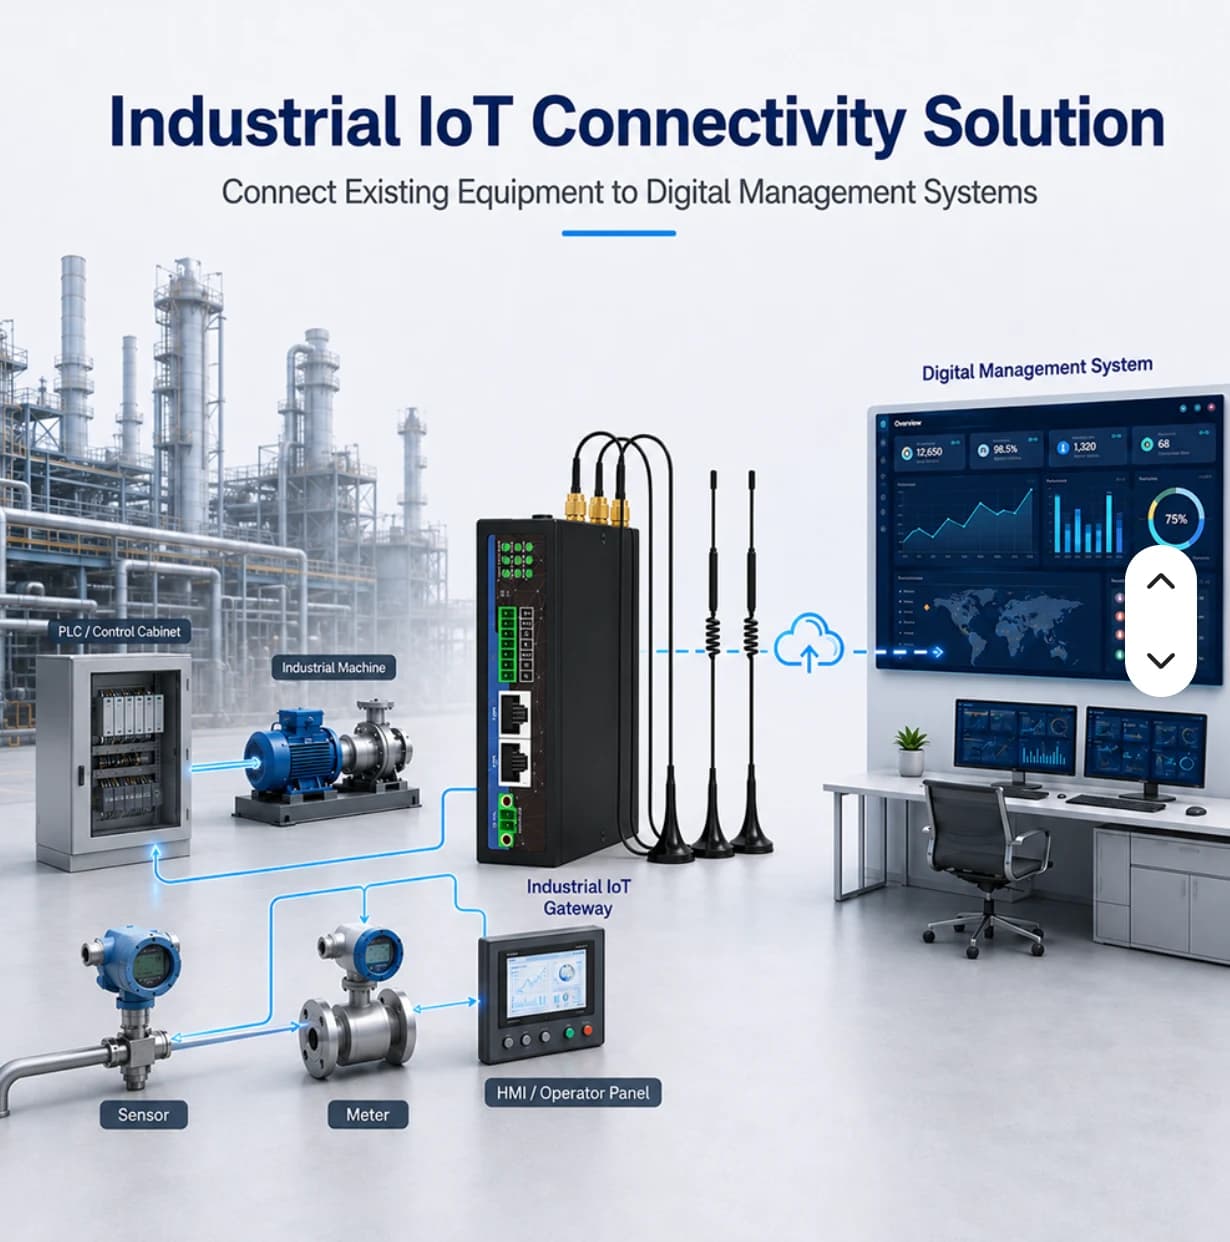
Machine Monitoring
Track machine status and signals across your production line.
Learn more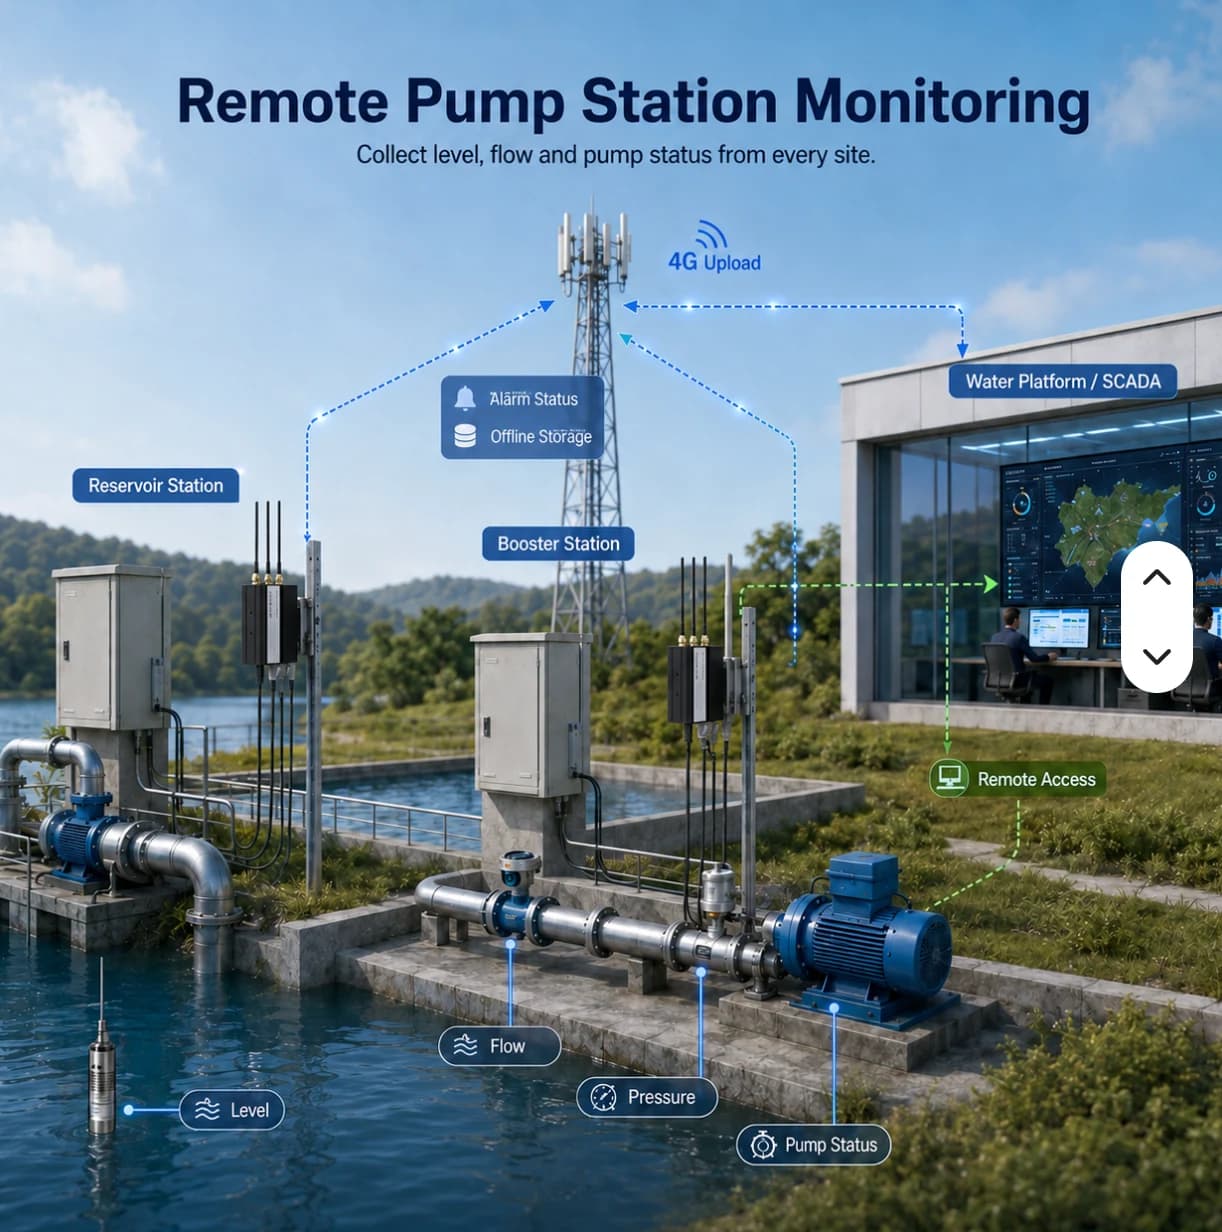
Remote Monitoring
Monitor pumps, water levels and gateway connectivity remotely.
Learn moreThe Demo Center shows sample dashboards for each solution with simulated data. No sign-up needed.
LoRa / LoRaWAN for wireless sensing; RFID and barcode for events; SCADA and factory control for processes; factory monitoring and OEE for production visibility.
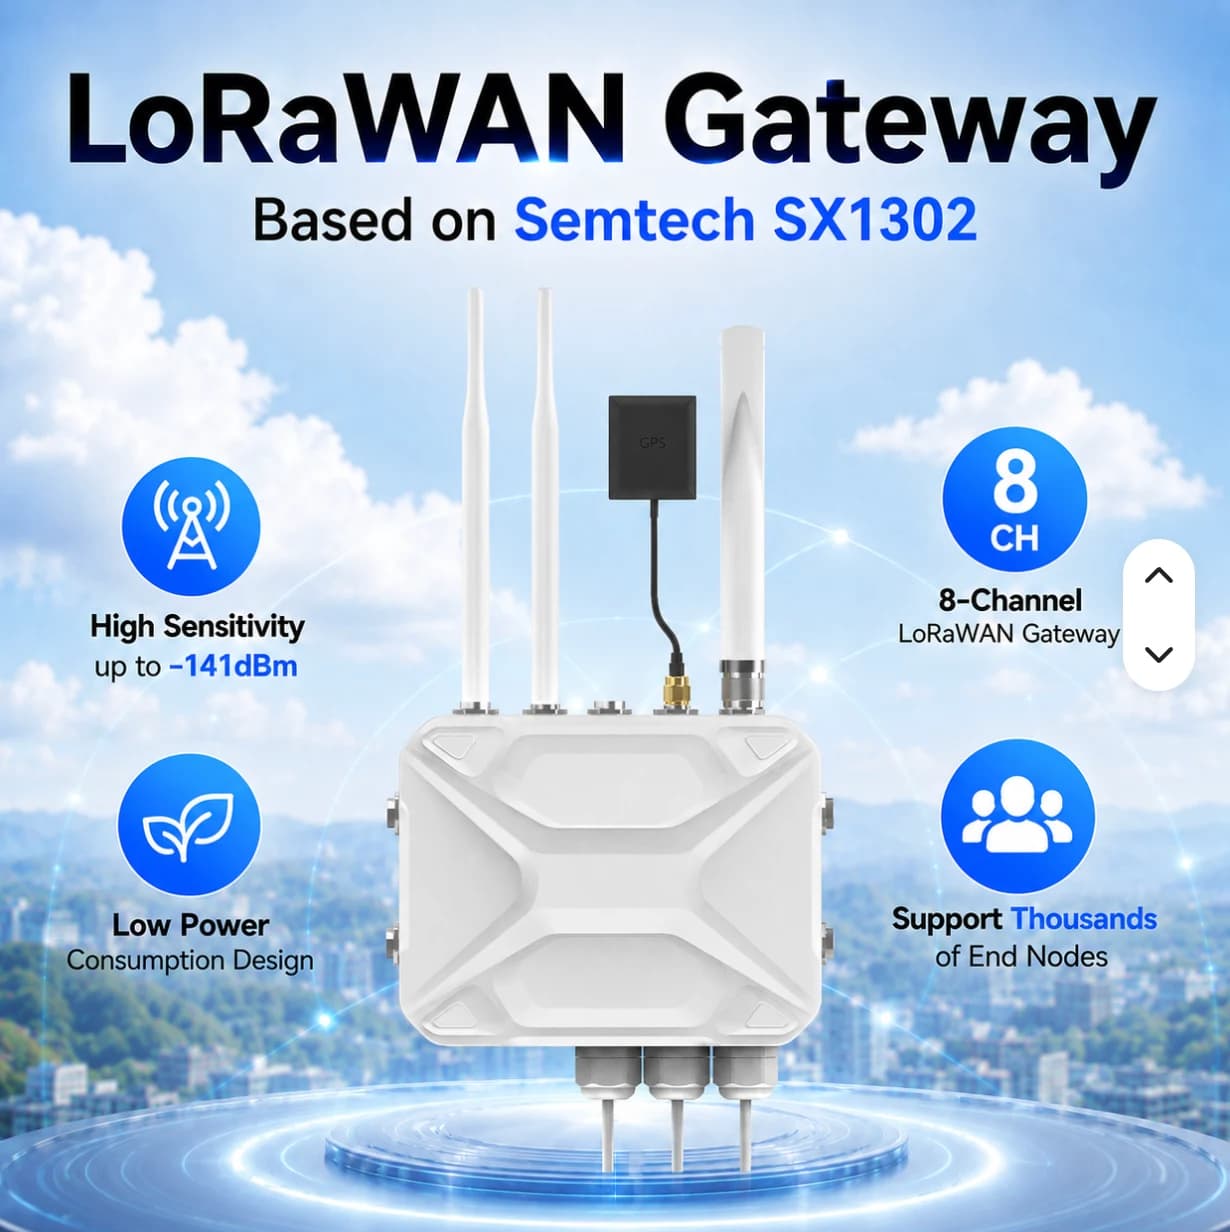
Aggregate LoRaWAN sensor data across outdoor sites. A pole-mounted enclosure for agriculture, buildings and utilities.
Explore details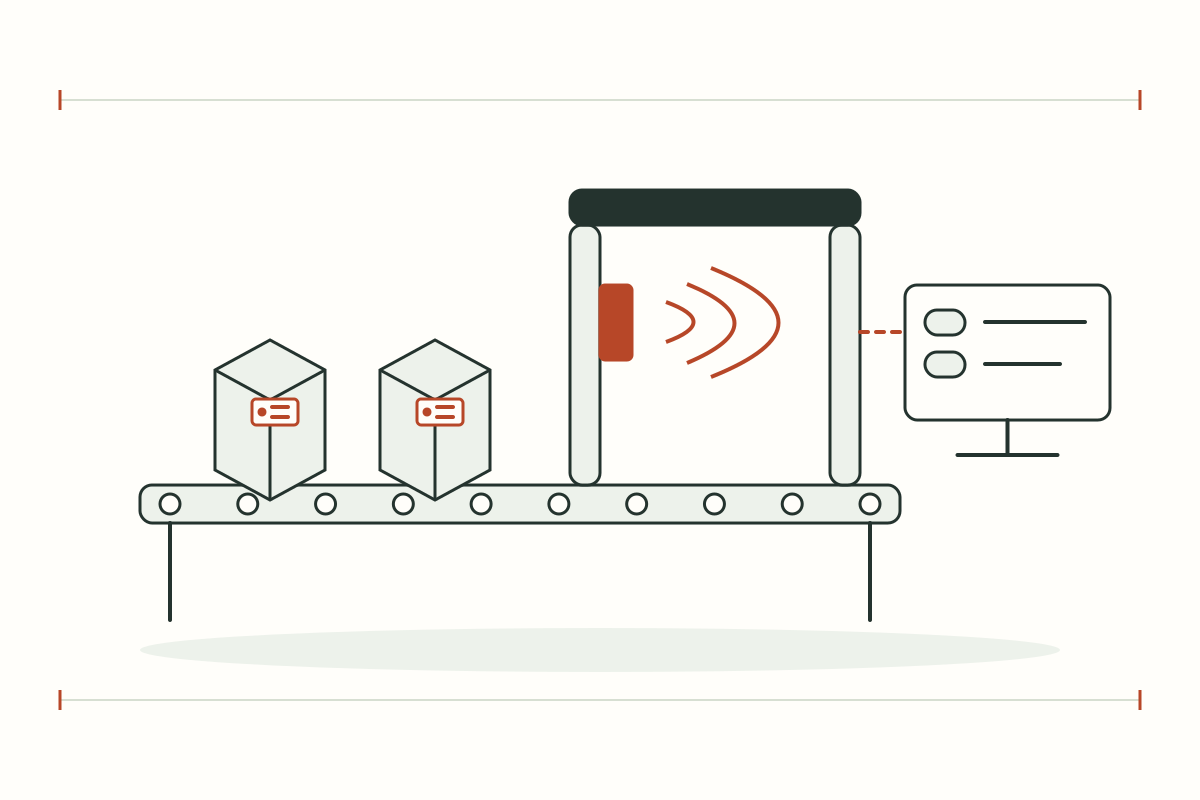
Identify assets, pallets and work in progress with readers and tags selected for each read zone.
Explore details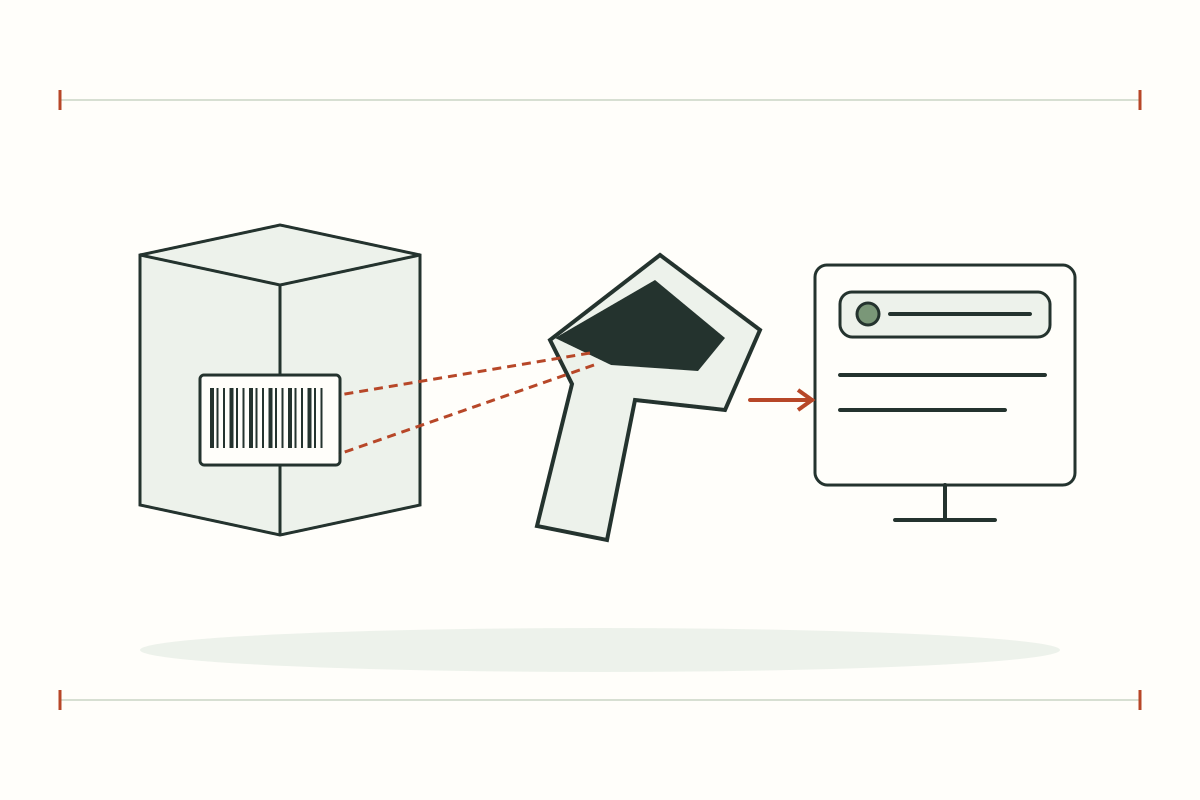
Capture item, lot and serial numbers at receiving, production and dispatch with a scanner workflow connected to your records.
Explore details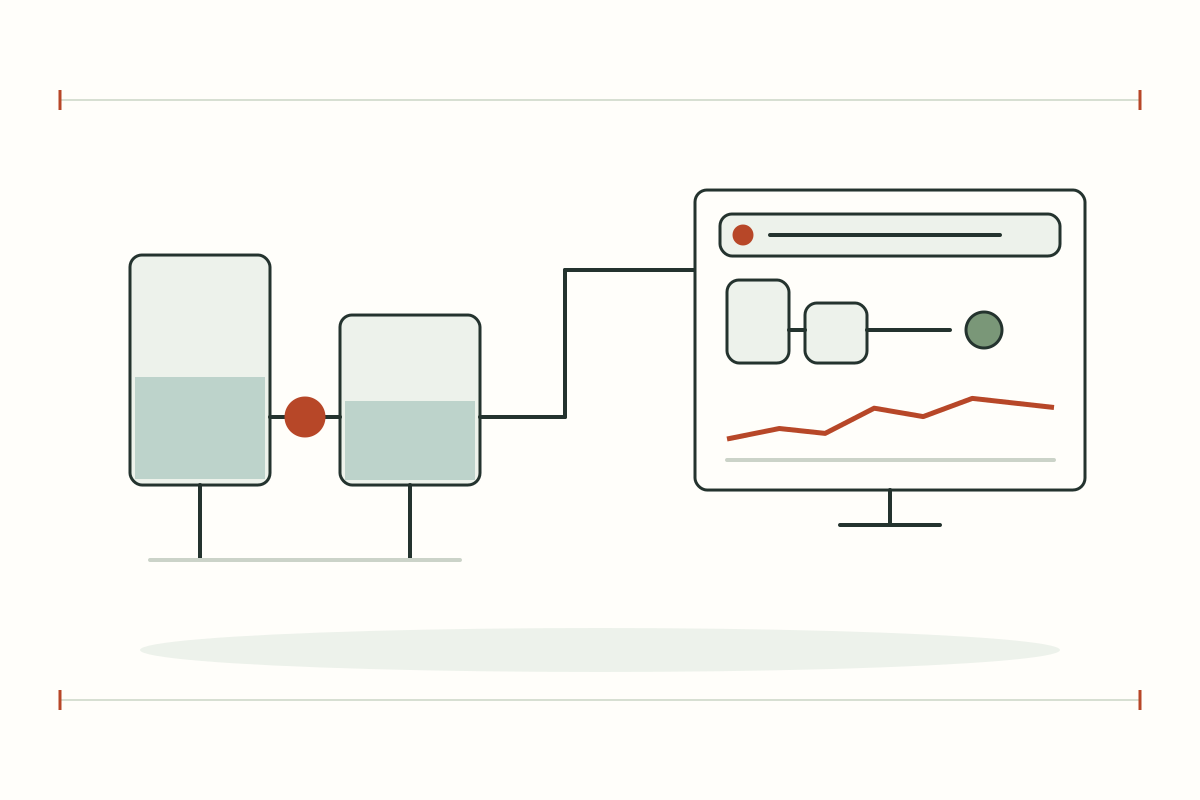
Bring process values, equipment states, alarms and trends into an operator view designed around the plant.
Explore details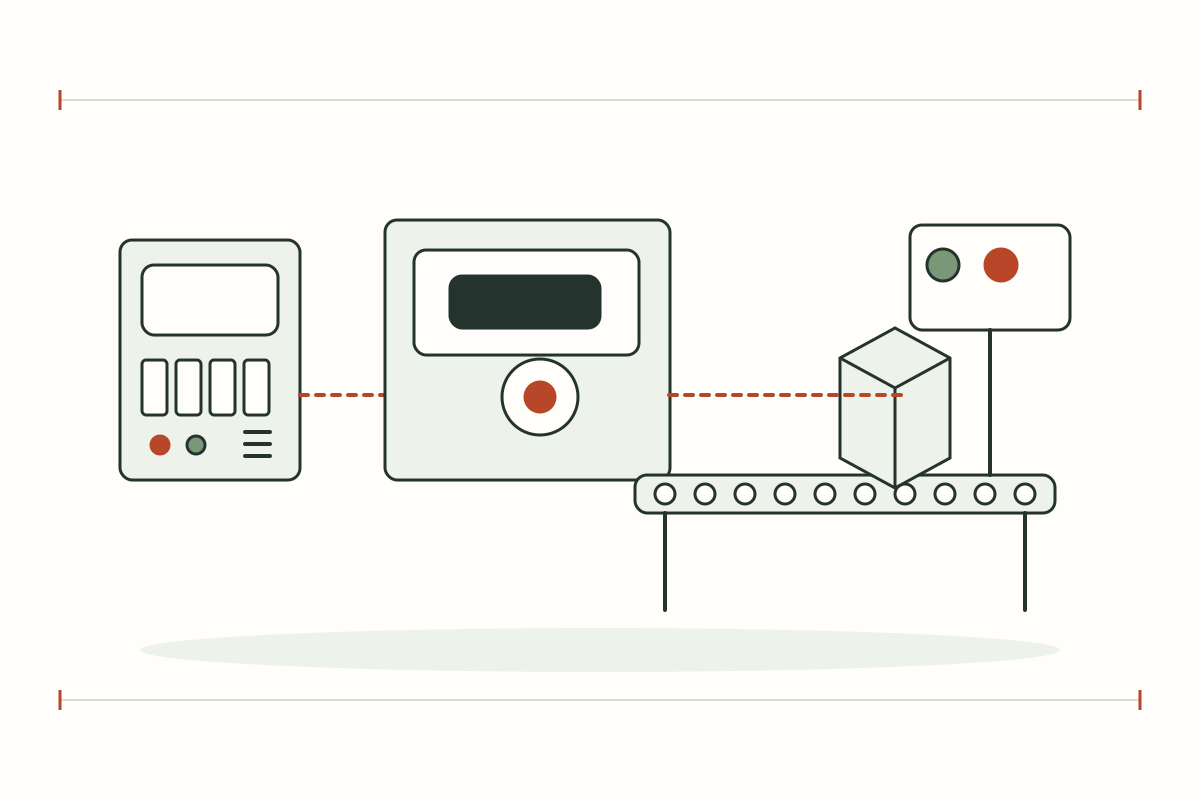
Design PLC, HMI and supervisory workflows for machine sequences, setpoints and production operations.
Explore details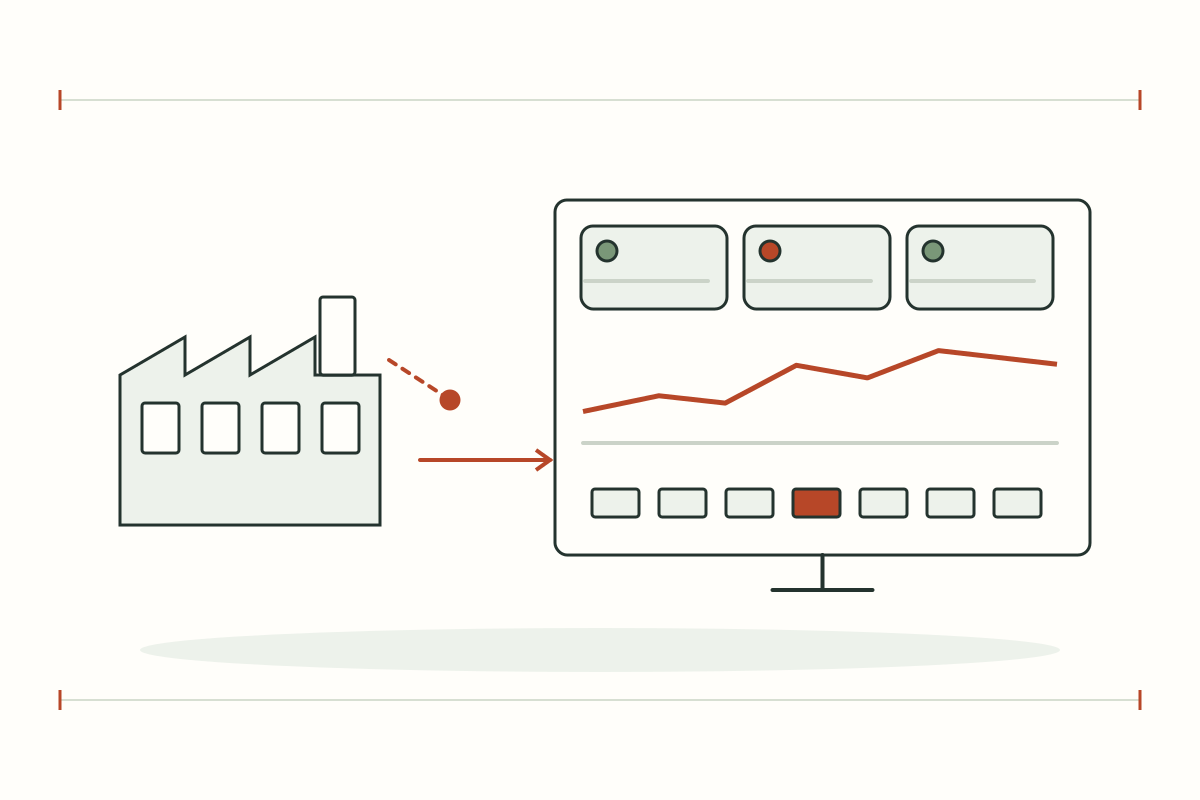
See machine states, production signals, energy and environmental readings by line, area and shift.
Explore details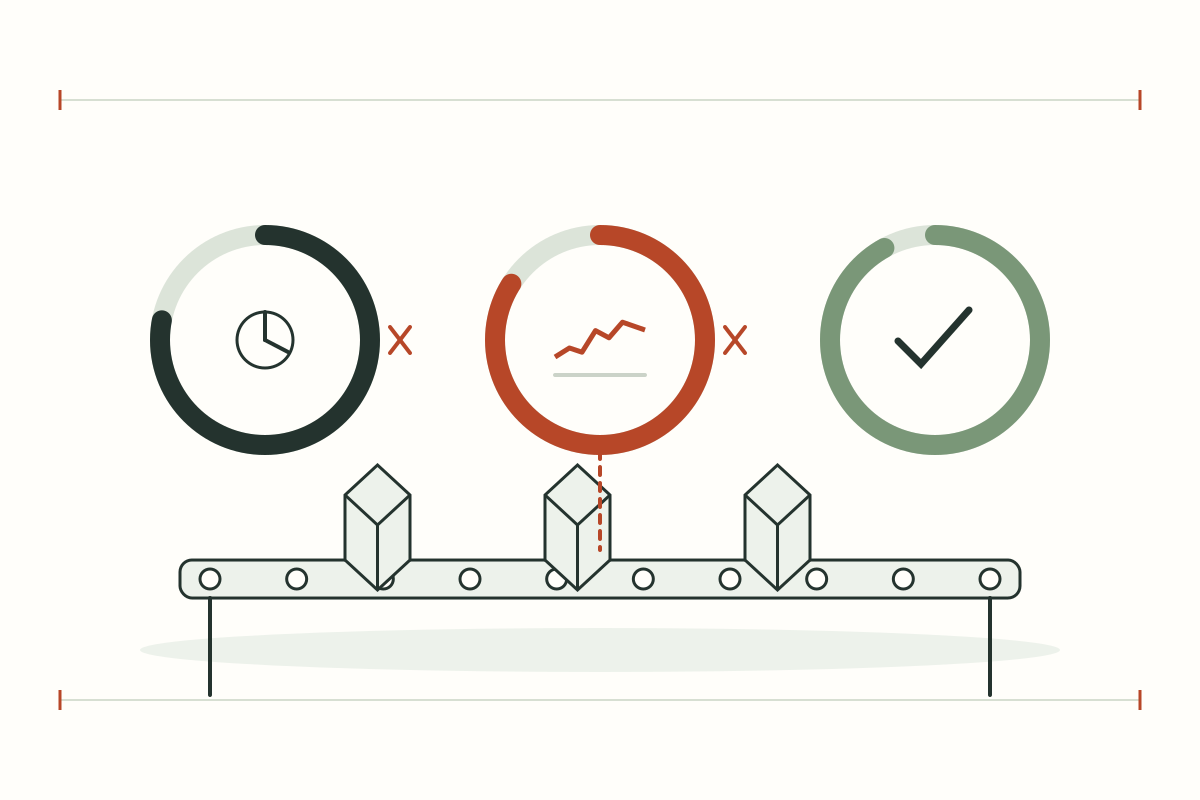
Plan Availability, Performance and Quality measurements to identify downtime, speed loss and rejected production.
Explore detailsChoose devices or an integrated system project. Device models, licences and integration scope are confirmed before quotation.
FACTORY APPLICATIONS
Illustrative system designs with equipment, data, responsible teams and project conditions. These are not customer case studies.
DIGITAL TWIN · SIMULATED
This simulated digital twin is a model running in your browser. It does not mirror a PLC or customer site and does not control equipment.
Live (simulated) · 08:00:00
Illustrative 3D layout, not surveyed coordinates. Scene labels show values from the simulated twin. Select equipment on the scene or in the twin tree.
WHAT-IF · SIMULATED
M-01 running
M-01 stopped
Computed from the browser simulation to compare choices; not a prediction for a real site.
Select a scene device, then inspect or control it
PLC / Meter → Modbus TCP / RS485 → Gateway → MQTT TLS :8883 → Monitor
CCTV uses IP over PoE / NVR independently of LoRaWAN. This scene is illustrative and has no live video.
Connect power readings and machine states to site locations for maintenance inspection.
Move from a monthly total to area-level meter readings that engineering teams can use to investigate loads and plan improvements.
Factories with multiple circuits or buildings that need separate energy readings
Explore problems, solutions and workflowConnect PLC or sensor signals so production and maintenance use the same observations before developing performance analytics.
Factories with readable PLC values or accessible state signals
Explore problems, solutions and workflowGive teams the latest readings, update times and connectivity context before deciding which location needs an on-site check.
Factories with distributed tanks, pumps or utility systems
Explore problems, solutions and workflowDETAILS & PLANNING
Energy monitoring starts with meter readings. Machine monitoring uses PLC states and sensor values. Remote monitoring adds connectivity and distributed-site responsibilities. Select the solution according to the operator’s question and the data actually available.
Define acceptance checks that demonstrate both data correctness and operational usefulness: compare a reading with the meter display, check connectivity loss and ask users to find a known event in history. Use the pilot findings when expanding to additional sites.
LoRa / LoRaWAN for wireless sensors, RFID and barcode for identifiers and events, SCADA for process supervision, factory control for automation, factory monitoring for readings, and OEE for production performance.
Review each system’s scope before opening it or using the example to plan your project.
Live public observations · Read-only
View rain, water-level and road-water observations on a station map with timestamps and source attribution.
Example workspace · Manual events
Register assets and EPCs, record manual zone events, inspect history and export CSV in a browser-specific example workspace.
Simulated data · No physical PLC commands
Explore machine states, energy, simulated readings and alarms with a 3D scene and example event history.
Organization platform · Sign-in required
Sign in to manage organization sites, devices, data points and packages. Confirm access rights and feature availability before operational use.
Yes, subject to device and package support. Define the data source and metric meaning for each use case.
Demo screens do not establish guaranteed outcomes. Results depend on site data, calculation definitions and operational changes. Check the platform page for advanced-feature availability.