Current plan
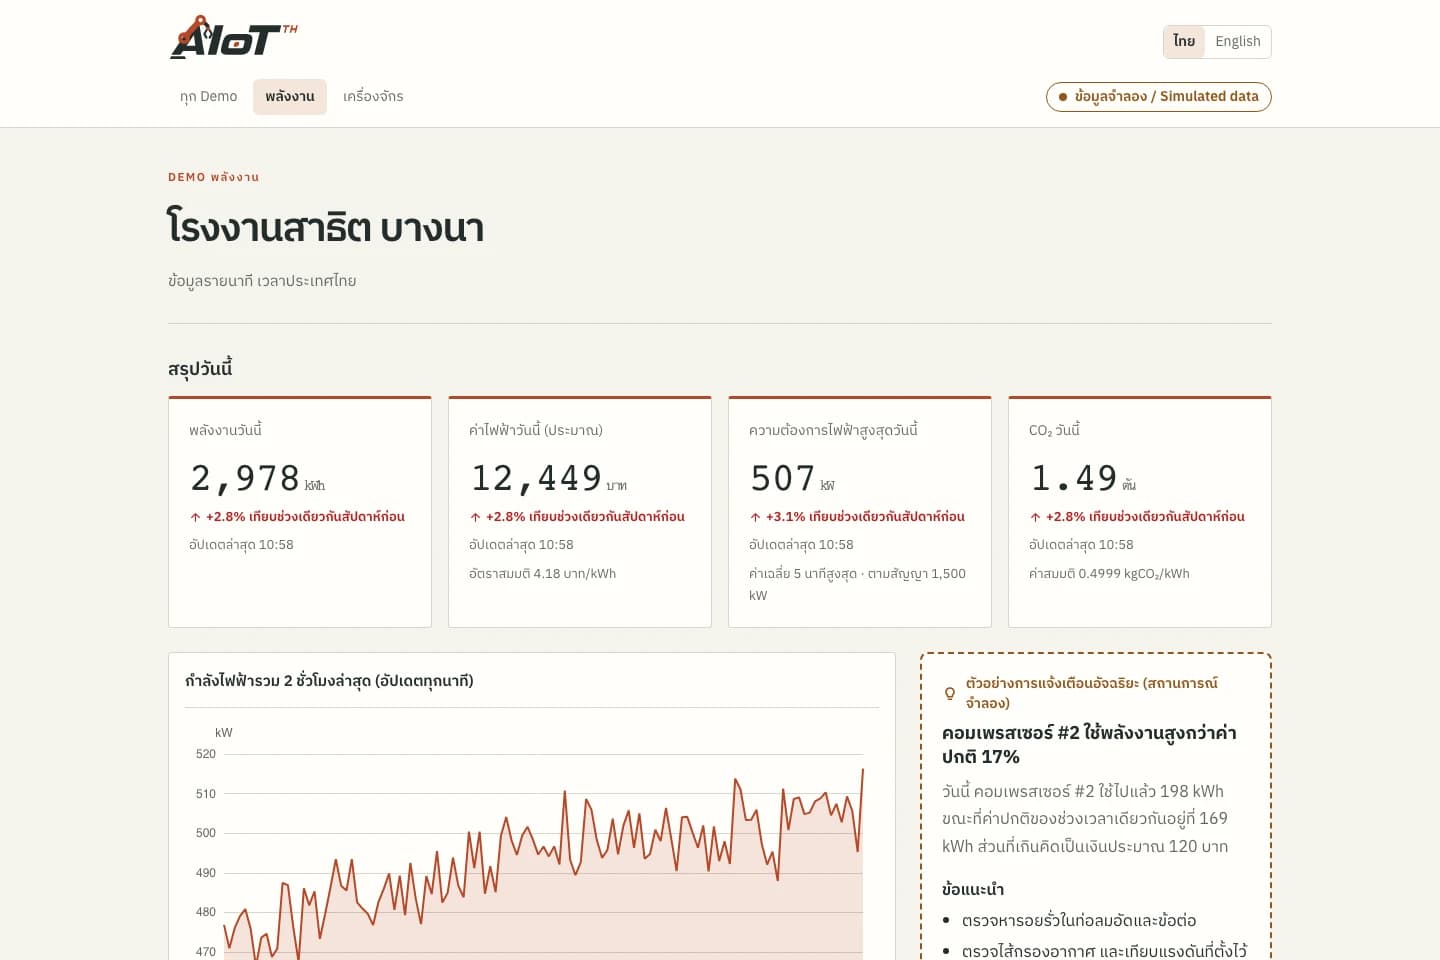
M-01 running
- Energy over 30 min
- 31.1 kWh
- Peak power
- 64.7 kW
Platform
AIoT TH Cloud receives data from all of your gateways, stores it as time series, displays it and alerts you — with each organization's data isolated from every other.
Scan the QR code on the gateway, pick a site, and the gateway comes online and receives its configuration from the cloud. No network setup on site.
See every gateway and device, its online / offline status and its data points, grouped by site, area and machine. Each gateway has its own credential that can be revoked immediately.
Latest values and history charts for every data point, on the web on desktop and mobile, in Thai and English.
Set high / low limits and get alerted when a device goes offline, via LINE and email. Acknowledge alerts and review their history.
Your company has one account with as many sites as you need, and each site has its own package. Users sign in once and see every site they have access to.
Assign administrators, engineers, operators and view-only users, for the whole company or per site.
The following capabilities are in development. The packages listed reflect the current plan and may change.
REST API and API keys to pass data to your other business systems.
Standard and above
Build your own dashboards with Grafana inside the cloud, using the same sign-in.
Add-on for Professional and above
Connect data to other systems or add your own logic, with a Node-RED instance dedicated to your account.
Add-on for Professional and above
Anomaly detection, daily summary reports and an assistant that answers questions from your data.
Professional and above
Designed to control and protect your organization's data, from the gateway to the cloud.
LoRa / LoRaWAN for wireless sensing; RFID and barcode for events; SCADA and factory control for processes; factory monitoring and OEE for production visibility.
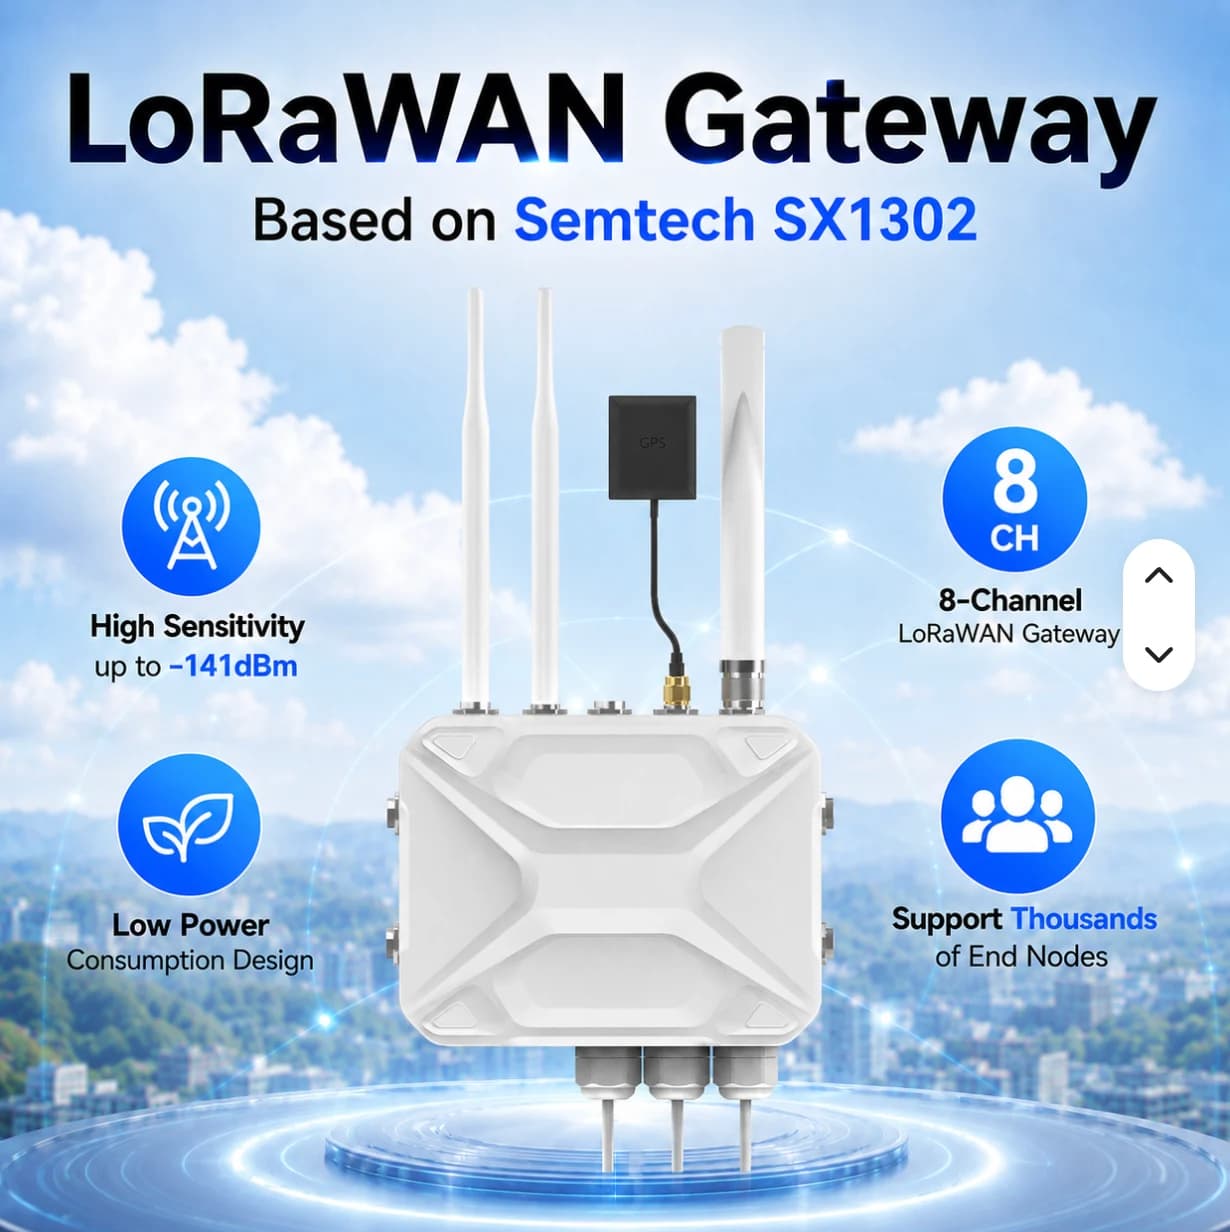
Aggregate LoRaWAN sensor data across outdoor sites. A pole-mounted enclosure for agriculture, buildings and utilities.
Explore details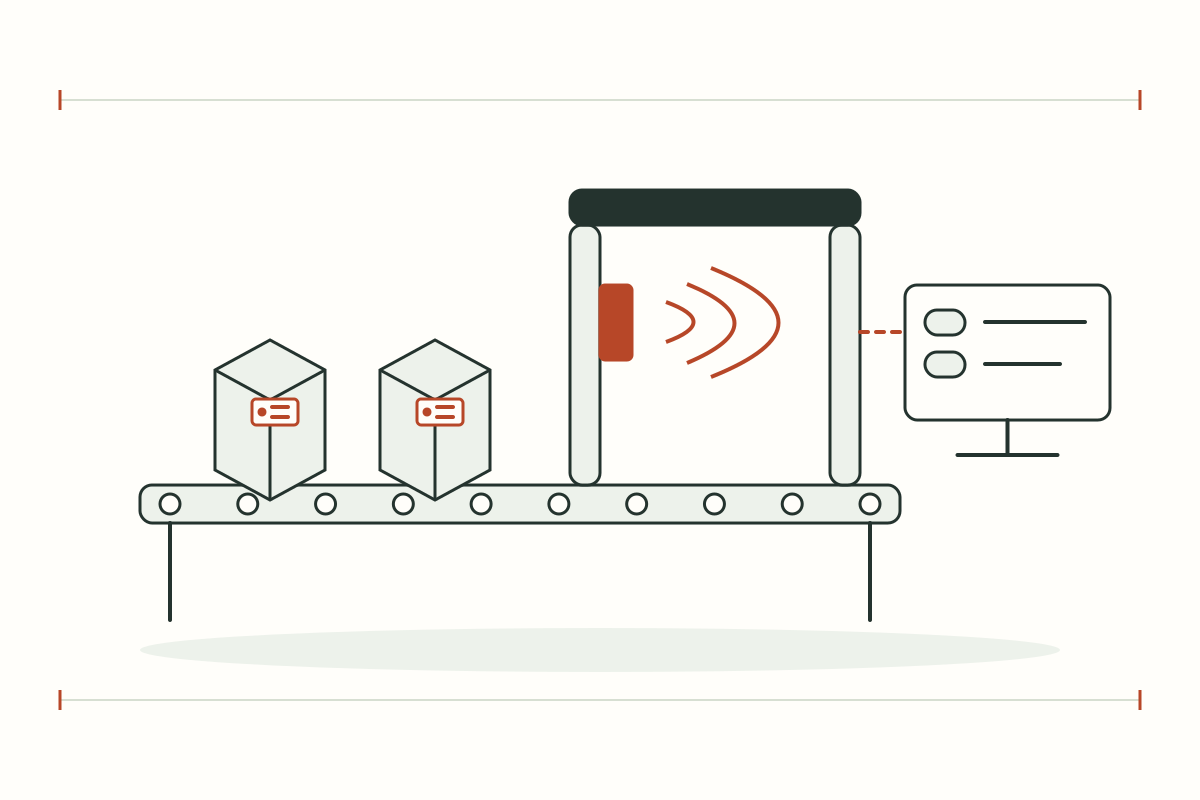
Identify assets, pallets and work in progress with readers and tags selected for each read zone.
Explore details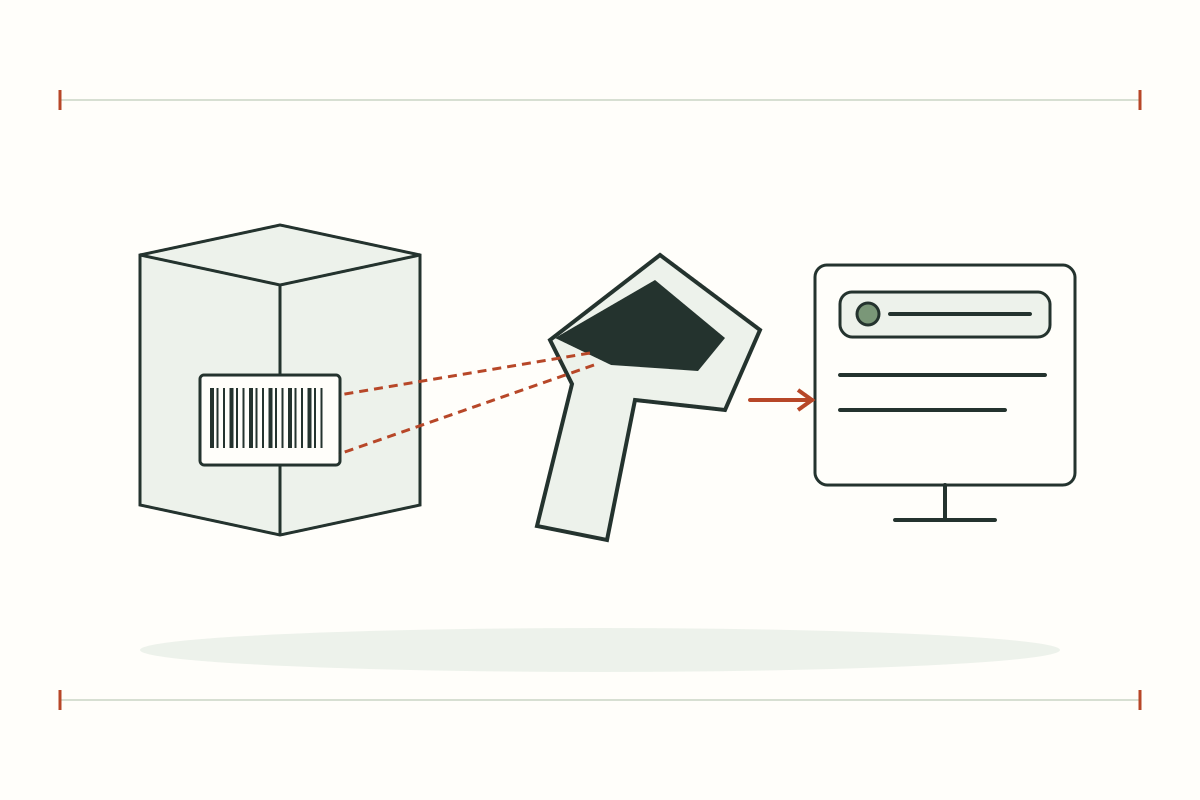
Capture item, lot and serial numbers at receiving, production and dispatch with a scanner workflow connected to your records.
Explore details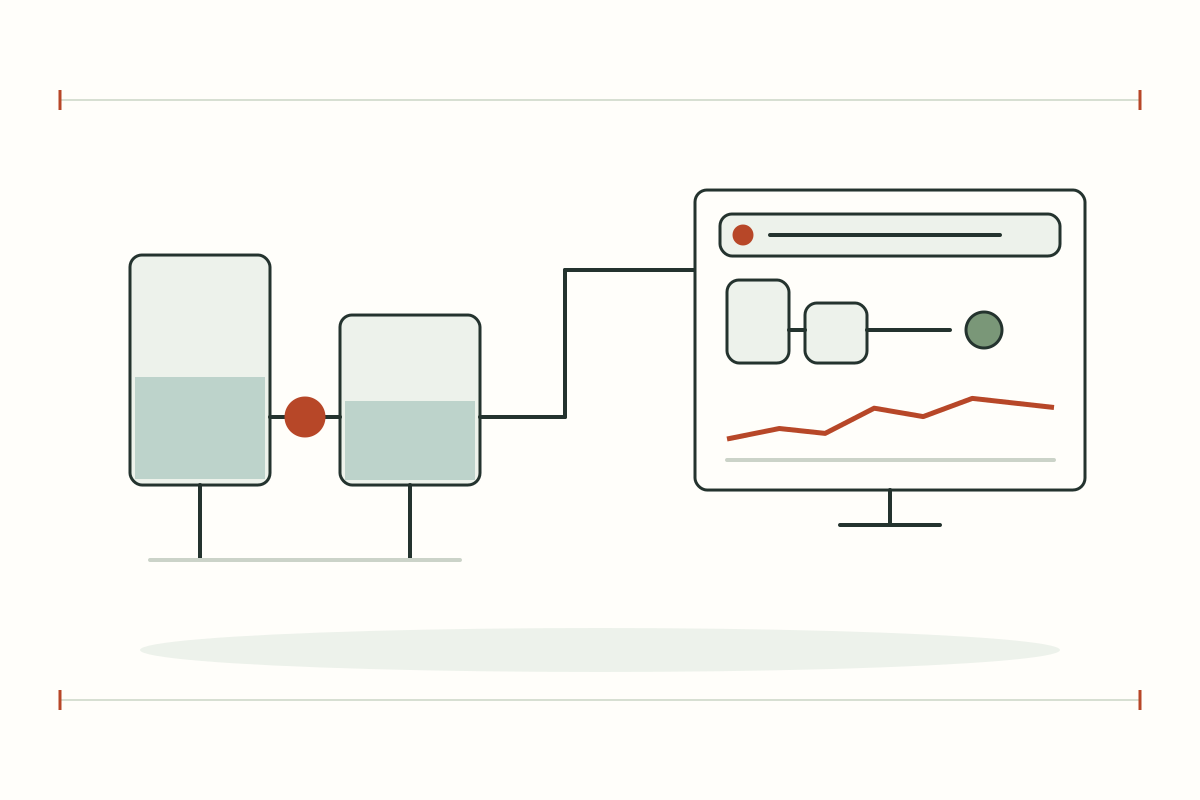
Bring process values, equipment states, alarms and trends into an operator view designed around the plant.
Explore details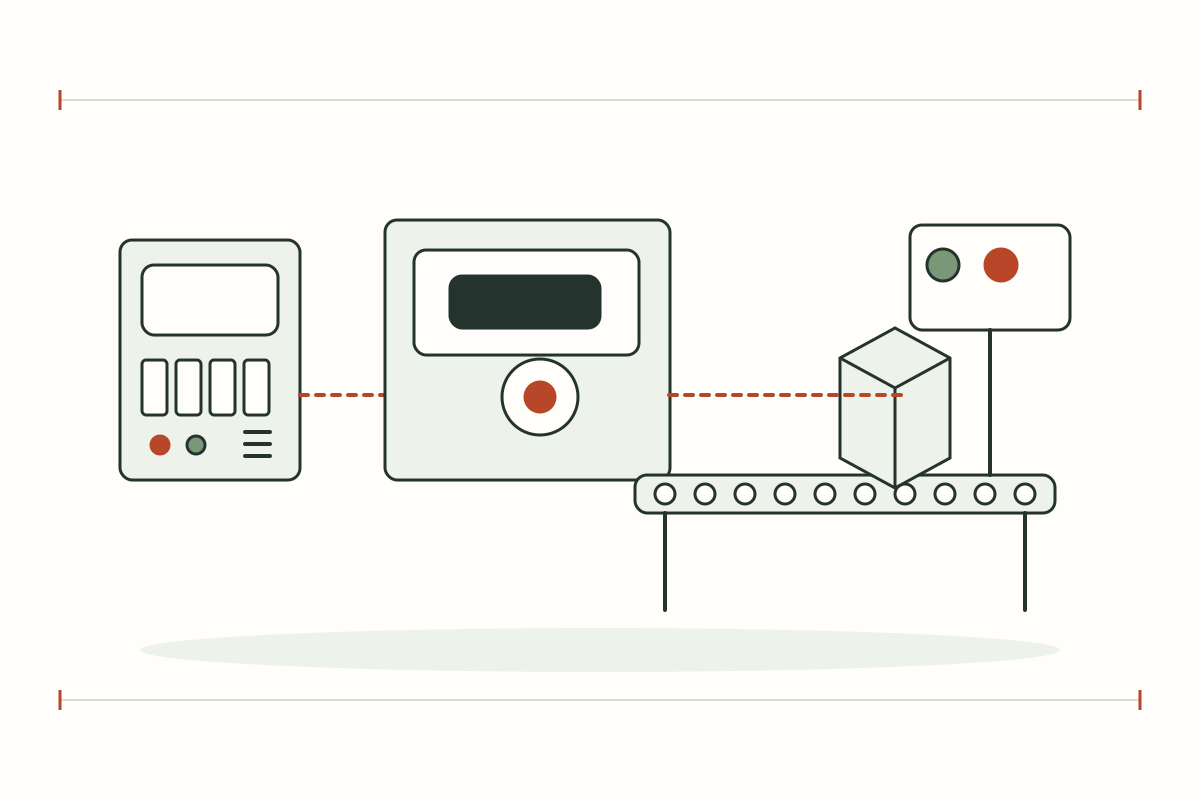
Design PLC, HMI and supervisory workflows for machine sequences, setpoints and production operations.
Explore details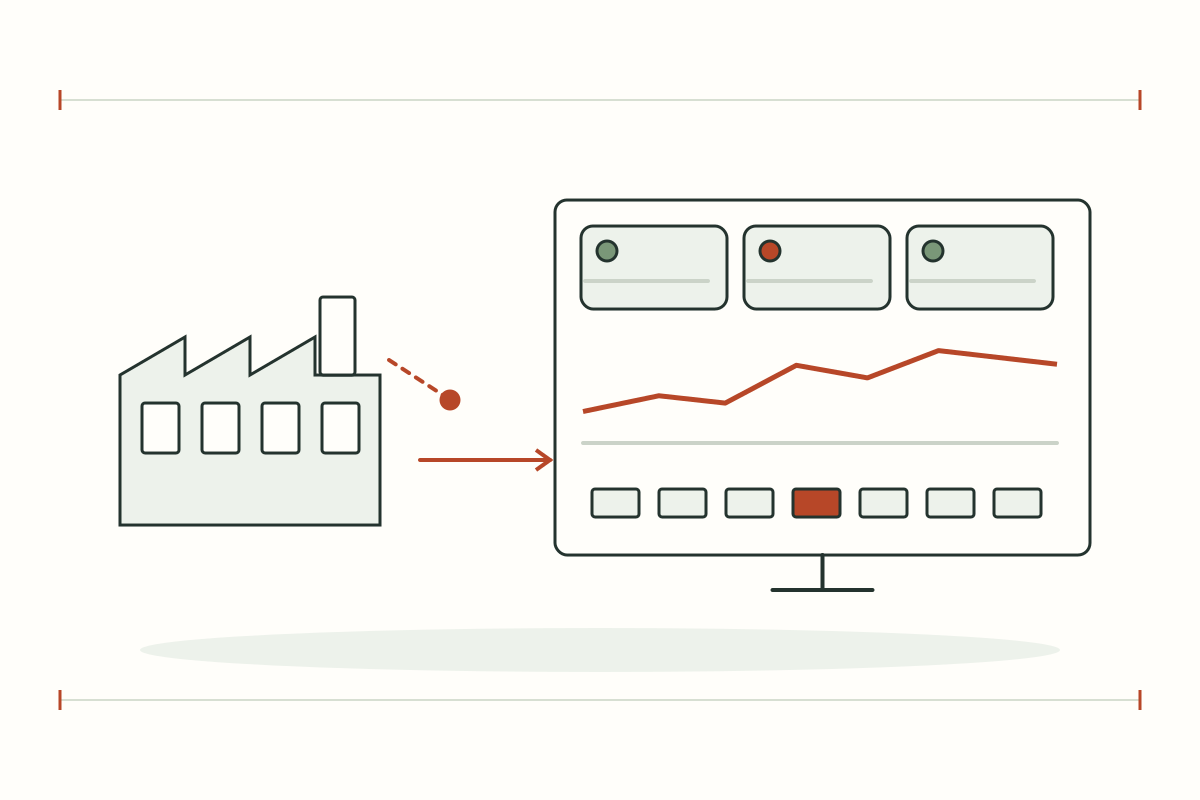
See machine states, production signals, energy and environmental readings by line, area and shift.
Explore details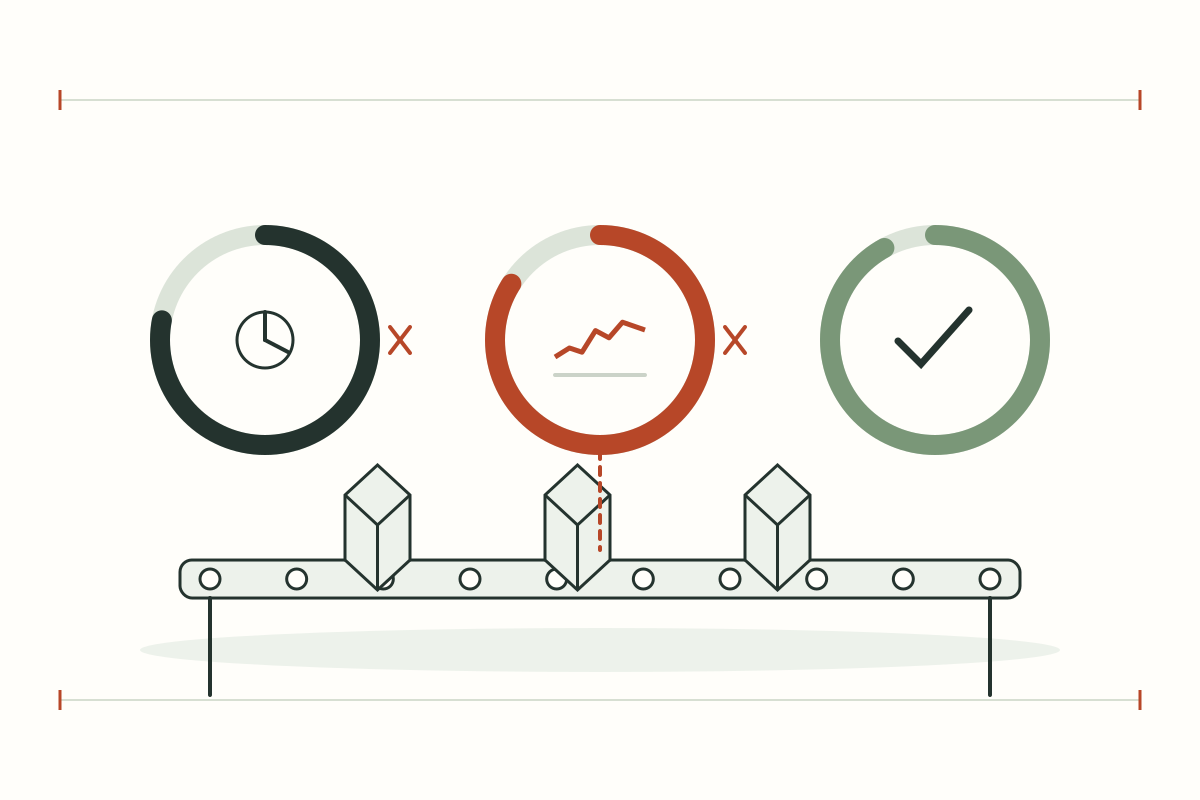
Plan Availability, Performance and Quality measurements to identify downtime, speed loss and rejected production.
Explore detailsChoose devices or an integrated system project. Device models, licences and integration scope are confirmed before quotation.
FACTORY APPLICATIONS
Illustrative system designs with equipment, data, responsible teams and project conditions. These are not customer case studies.
DIGITAL TWIN · SIMULATED
This simulated digital twin is a model running in your browser. It does not mirror a PLC or customer site and does not control equipment.
Live (simulated) · 08:00:00
Illustrative 3D layout, not surveyed coordinates. Scene labels show values from the simulated twin. Select equipment on the scene or in the twin tree.
WHAT-IF · SIMULATED
M-01 running
M-01 stopped
Computed from the browser simulation to compare choices; not a prediction for a real site.
Select a scene device, then inspect or control it
PLC / Meter → Modbus TCP / RS485 → Gateway → MQTT TLS :8883 → Monitor
CCTV uses IP over PoE / NVR independently of LoRaWAN. This scene is illustrative and has no live video.
Connect power readings and machine states to site locations for maintenance inspection.
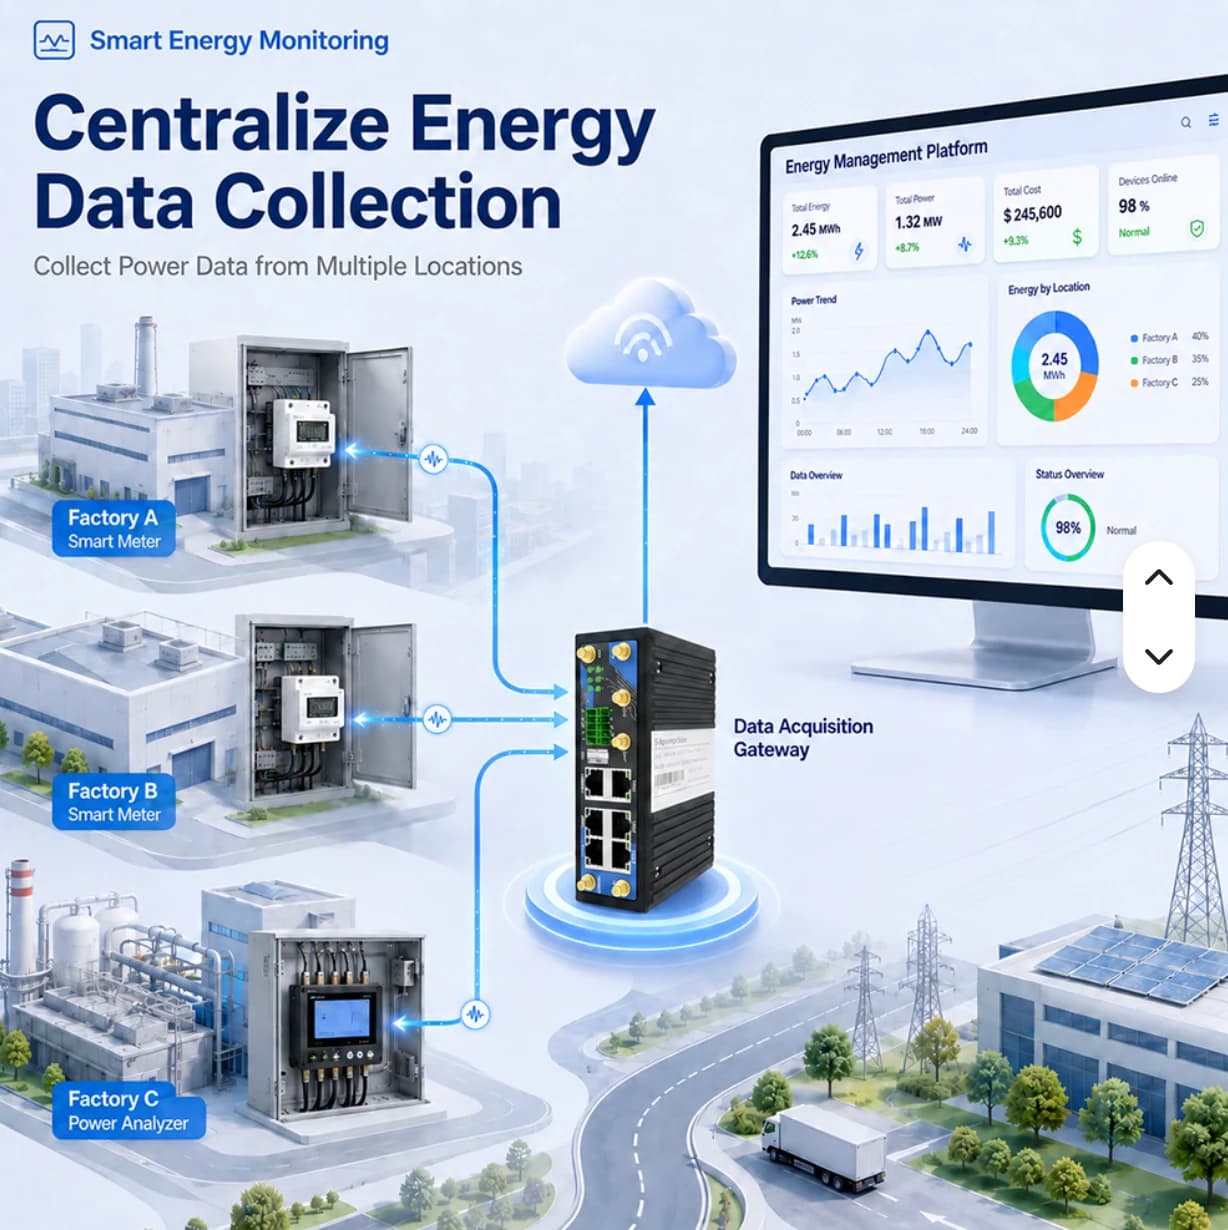
Move from a monthly total to area-level meter readings that engineering teams can use to investigate loads and plan improvements.
Factories with multiple circuits or buildings that need separate energy readings
Explore problems, solutions and workflow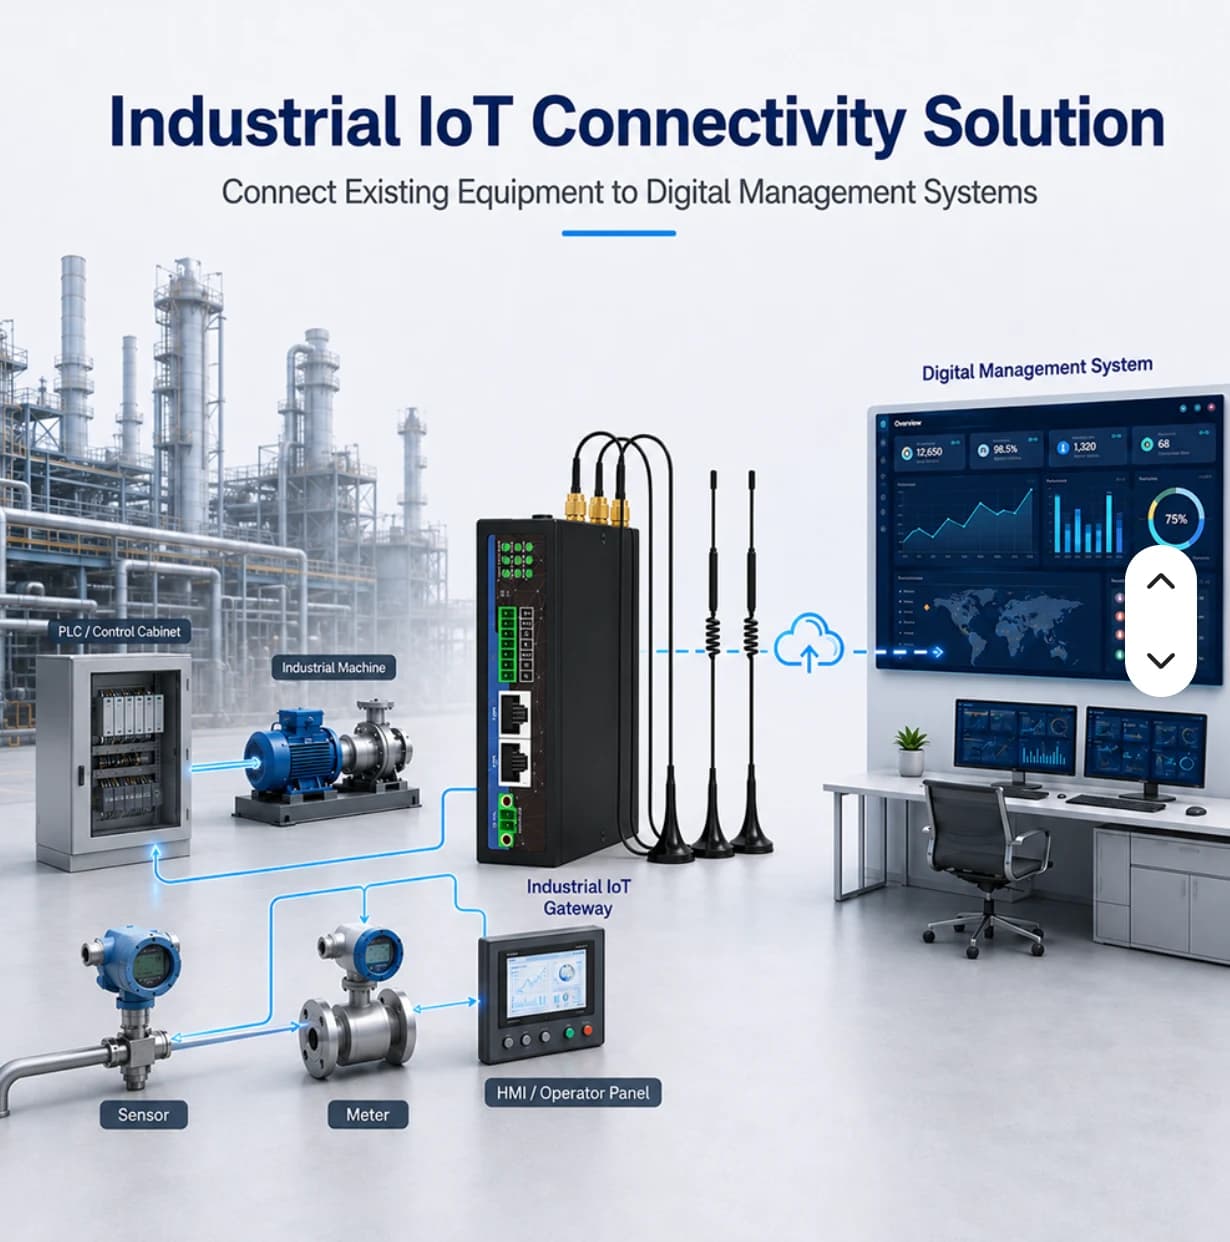
Connect PLC or sensor signals so production and maintenance use the same observations before developing performance analytics.
Factories with readable PLC values or accessible state signals
Explore problems, solutions and workflow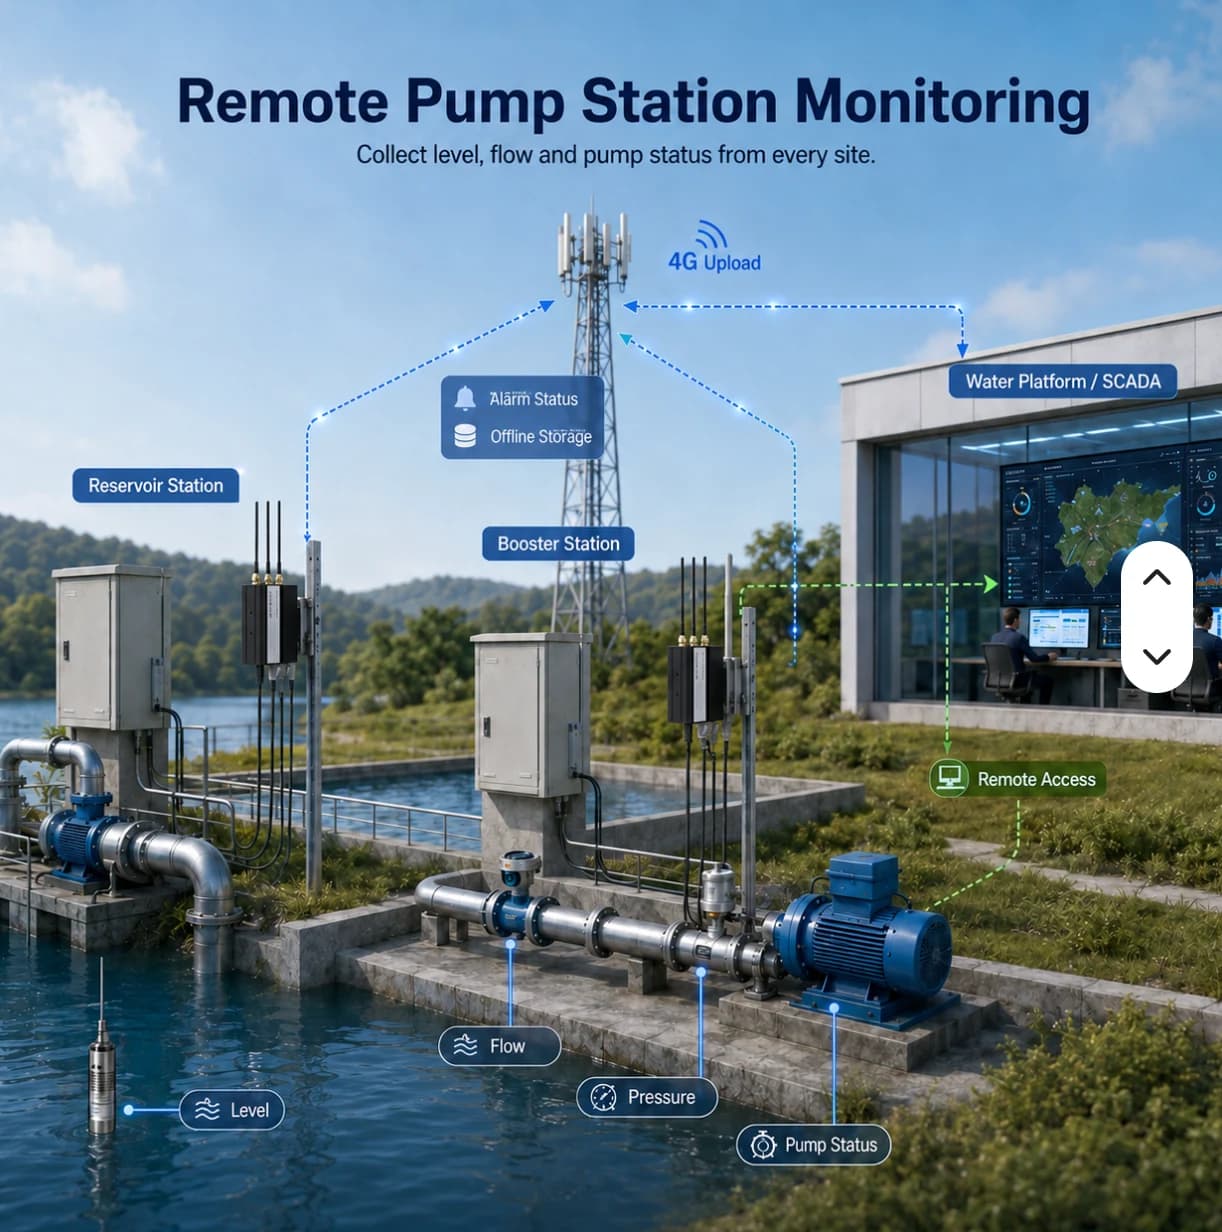
Give teams the latest readings, update times and connectivity context before deciding which location needs an on-site check.
Factories with distributed tanks, pumps or utility systems
Explore problems, solutions and workflowDETAILS & PLANNING
The organization defines the data boundary. Sites organize locations and subscriptions, while areas and assets give measurements context. Agree the structure with operations before onboarding many devices, reducing later renaming and reorganization.
After registering a gateway, verify connectivity and actual readings before setting alert thresholds. Use a known operational event to check historical charts. Handover should cover point management and the procedure for investigating network problems.
LoRa / LoRaWAN for wireless sensors, RFID and barcode for identifiers and events, SCADA for process supervision, factory control for automation, factory monitoring for readings, and OEE for production performance.
Review each system’s scope before opening it or using the example to plan your project.
Organization platform · Sign-in required
Sign in to manage organization sites, devices, data points and packages. Confirm access rights and feature availability before operational use.
Demonstration with simulated data
Explore energy, machine monitoring and OEE examples with a 3D factory to understand data and workflows before planning a project.
No. They run in different locations. Check hardware Node-RED support by variant; cloud Flows is a roadmap capability with its own platform access scope.
Demo insights are simulated scenarios. Follow the availability labels on this page and the project proposal for AI insights and advanced analytics.
Look at the sample dashboards in the demo, or talk to our team to choose the right gateway and package for your site.