Hardware / AIoT Gateway

Connect field equipment to the cloud

Gateways, LoRaWAN, RFID readers and barcode scanners for device readings and operational events, selected for site protocols and conditions.

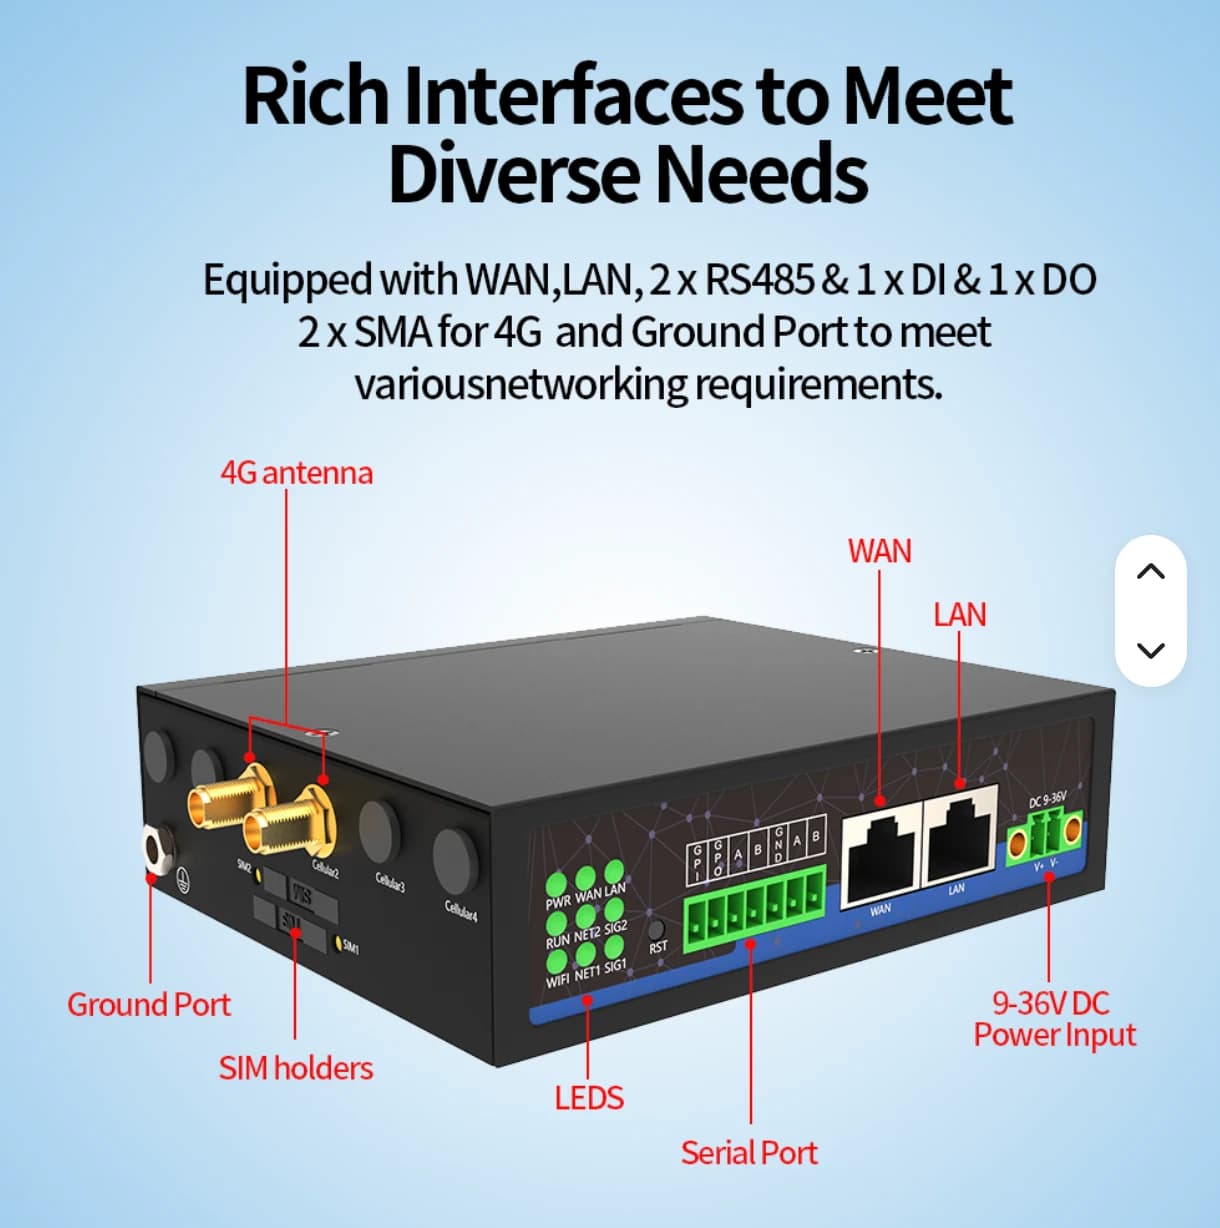
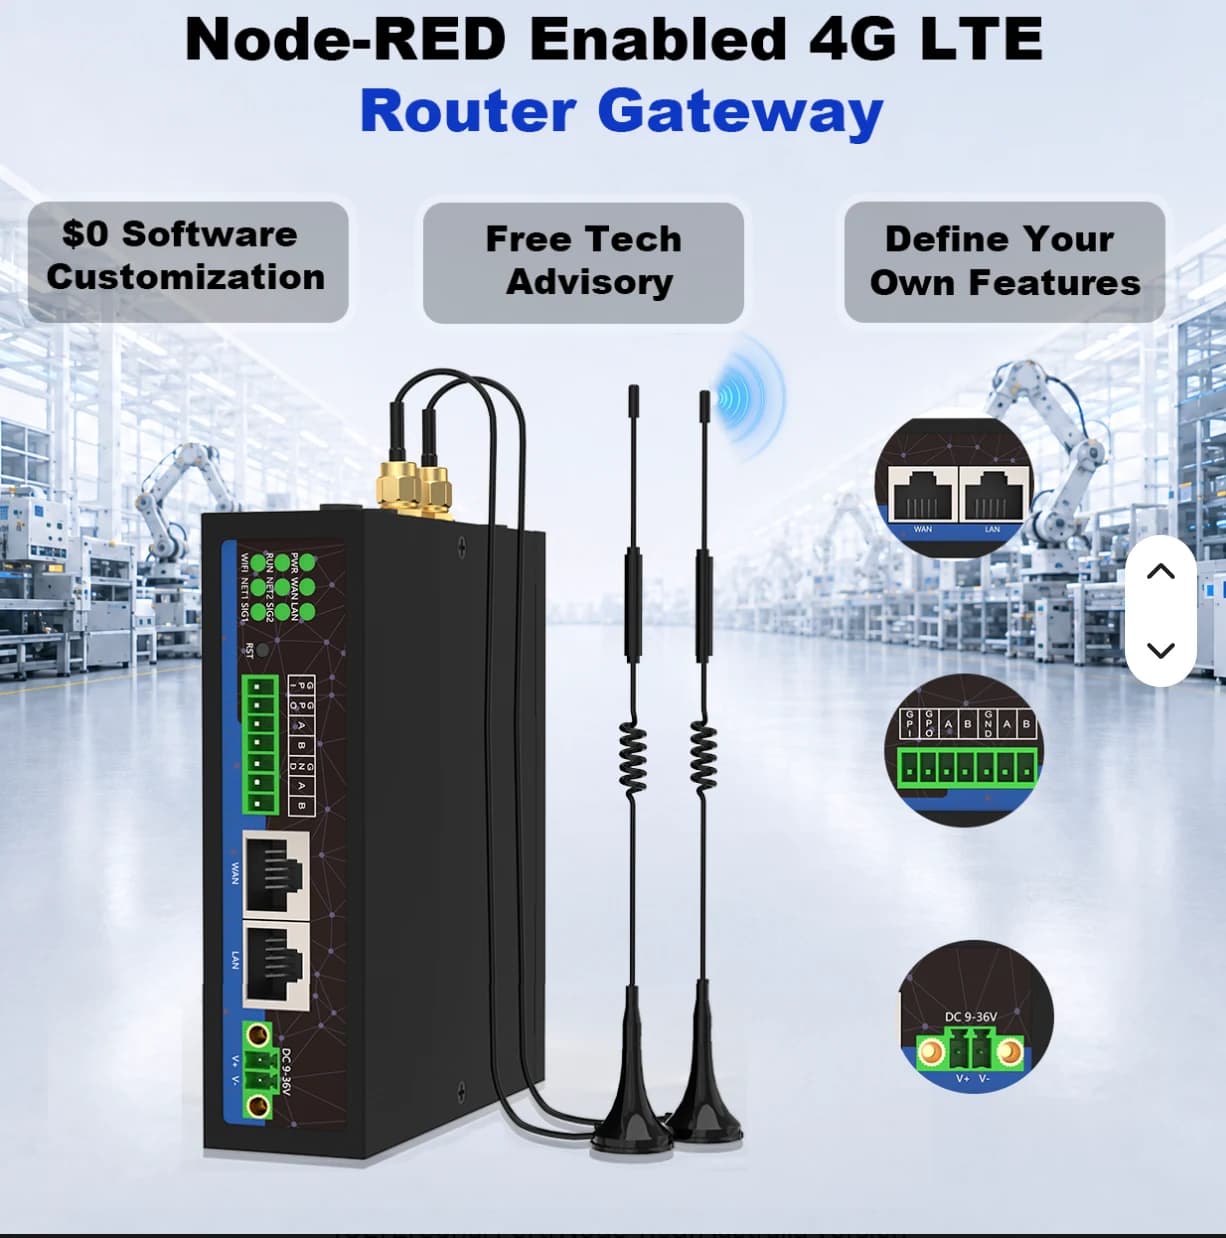
Supplier reference for Industrial 4G LTE Router with antennas

Choose a gateway for your site

Connect wired industrial equipment or collect wireless sensor data outdoors.

Supplier reference for Industrial 4G LTE Router with antennas

01 / WIRED / INDUSTRIAL

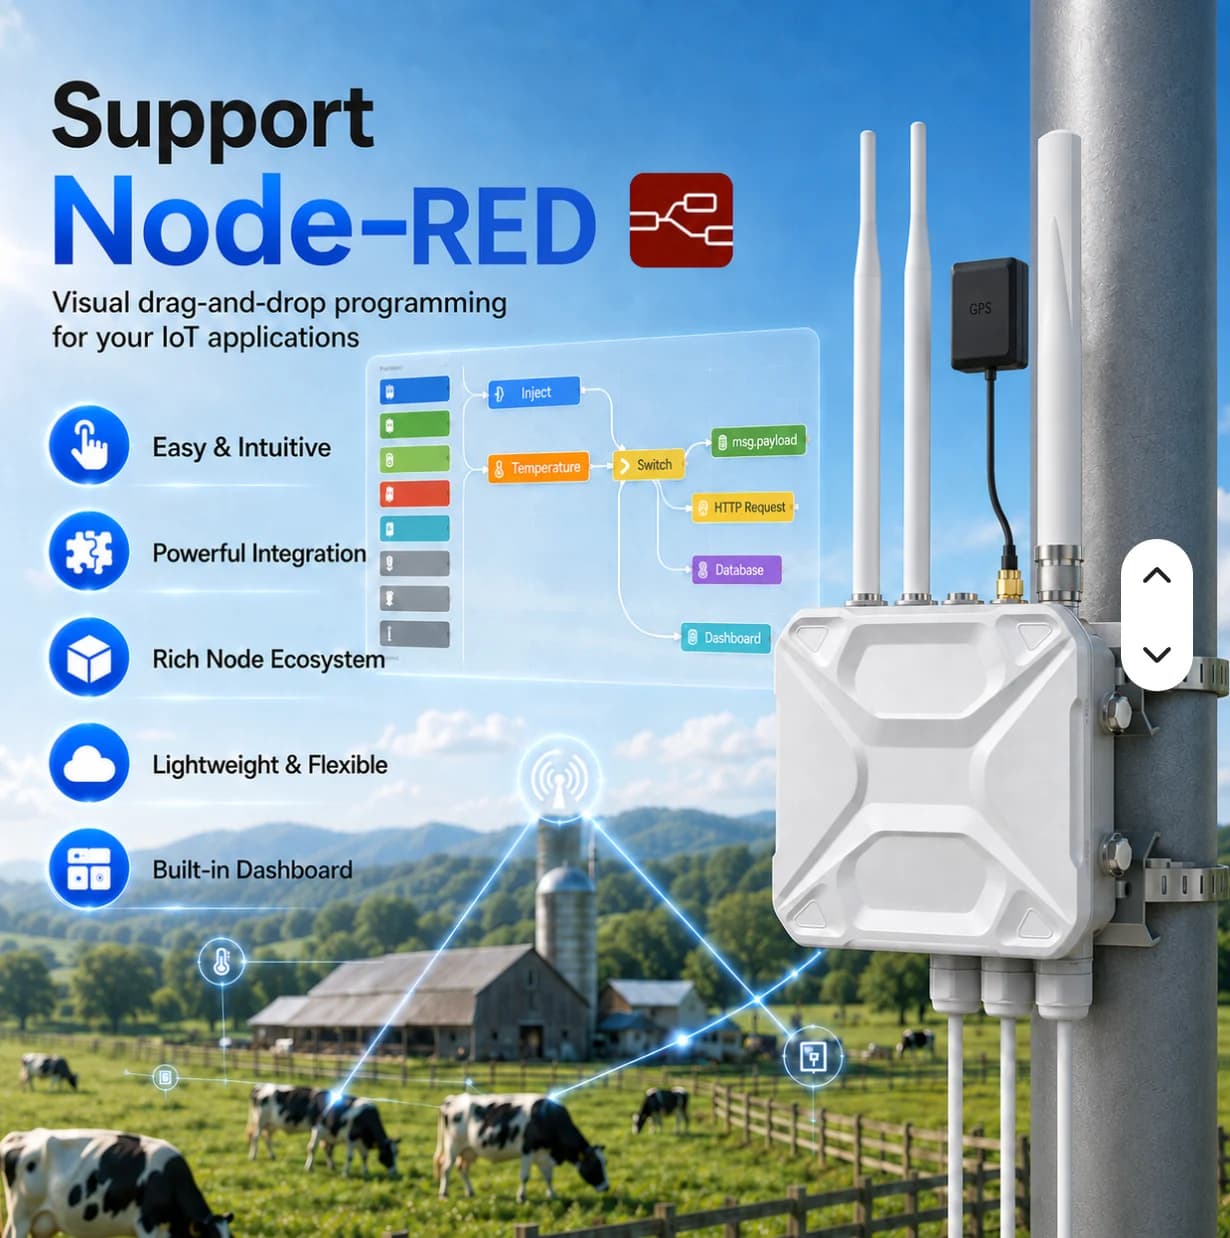
Industrial 4G LTE Router

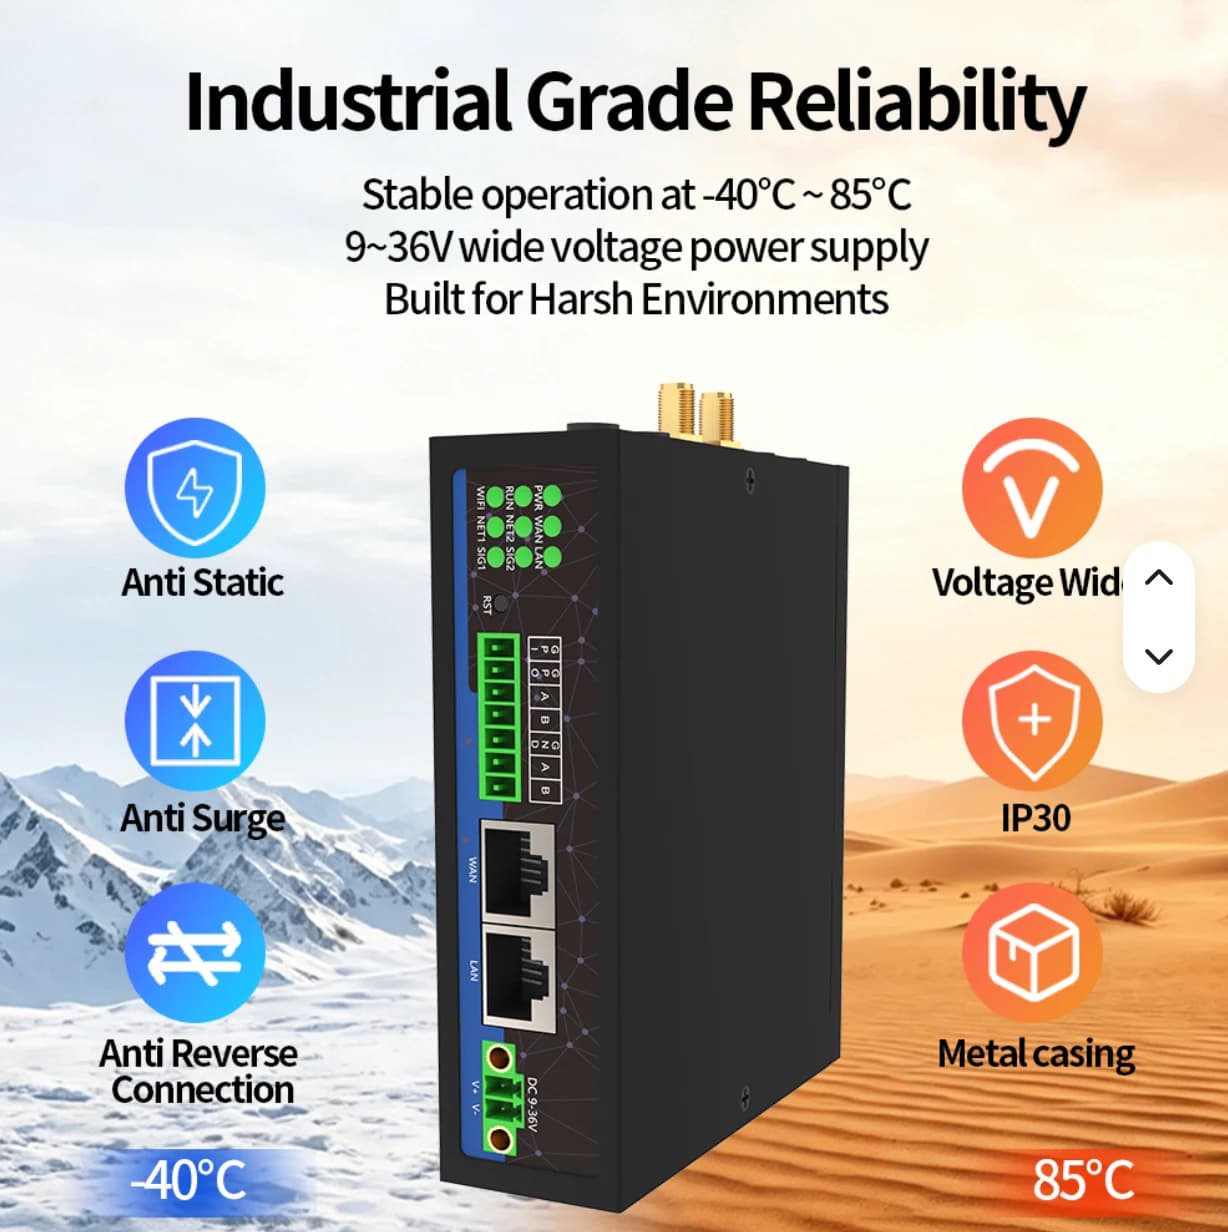
A gateway for control cabinets, PLCs and meters, with Ethernet, RS485, 4G LTE and Node-RED.

Interfaces
1 WAN + 1 LAN · 2 RS485
I/O
1 DI + 1 DO
Power
9–36 V DC
Software
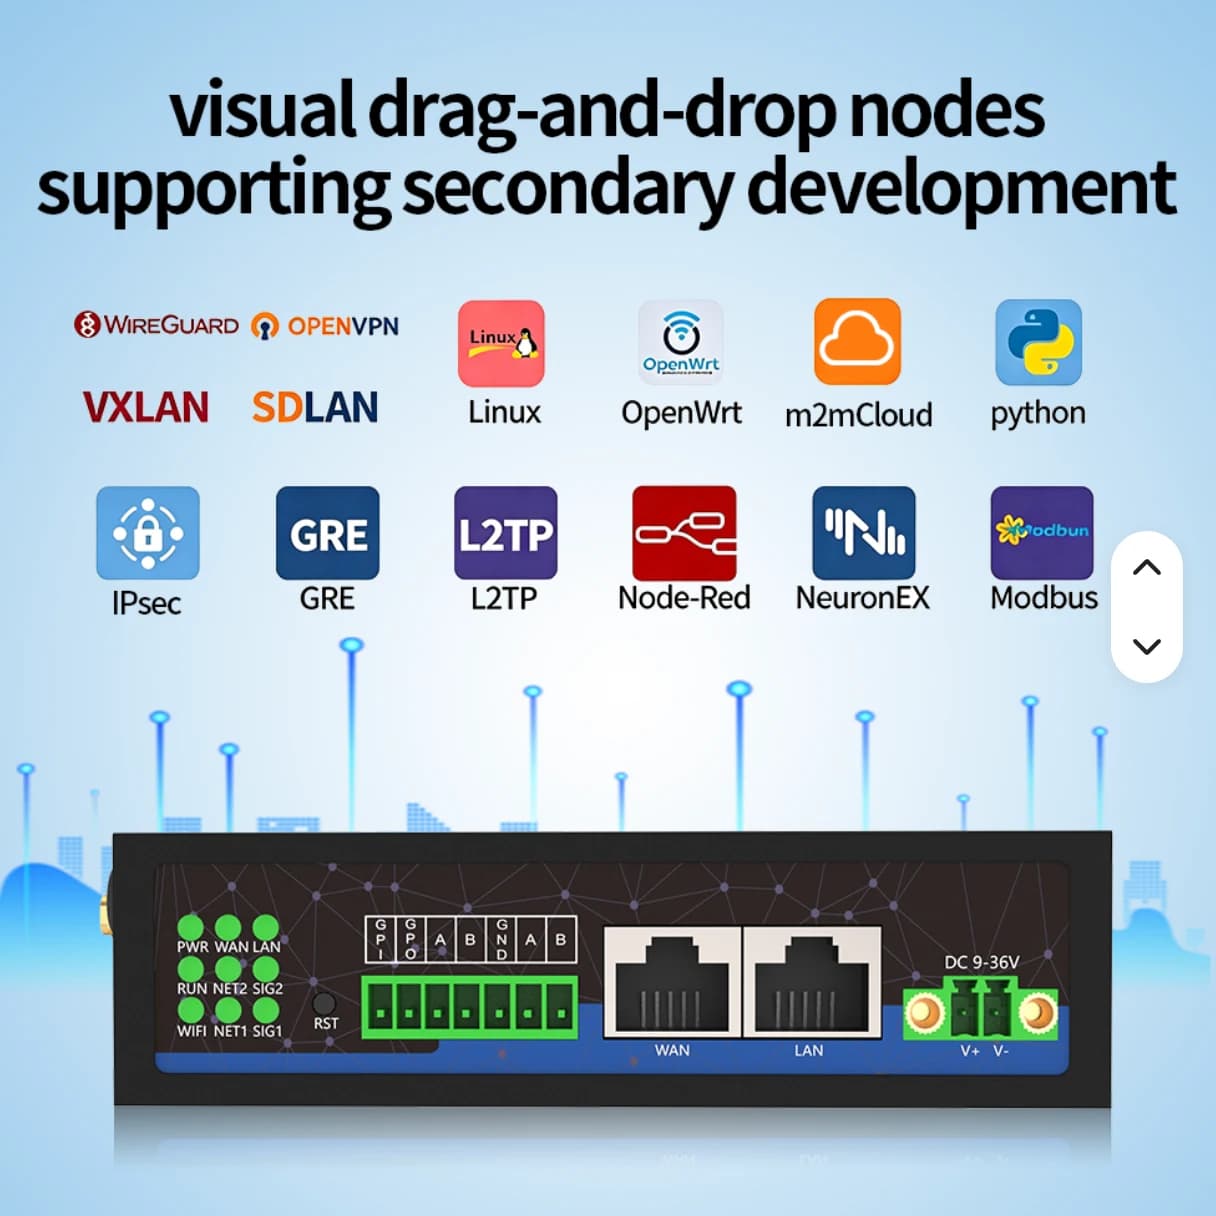
Node-RED · Linux / OpenWrt · Python

For factories, electrical cabinets and wired measurement points.

DO is a hardware capability. AIoT TH Phase 1 reads data; device control and optional software require a separate project scope.

Product and installation detailsEnquire about this product
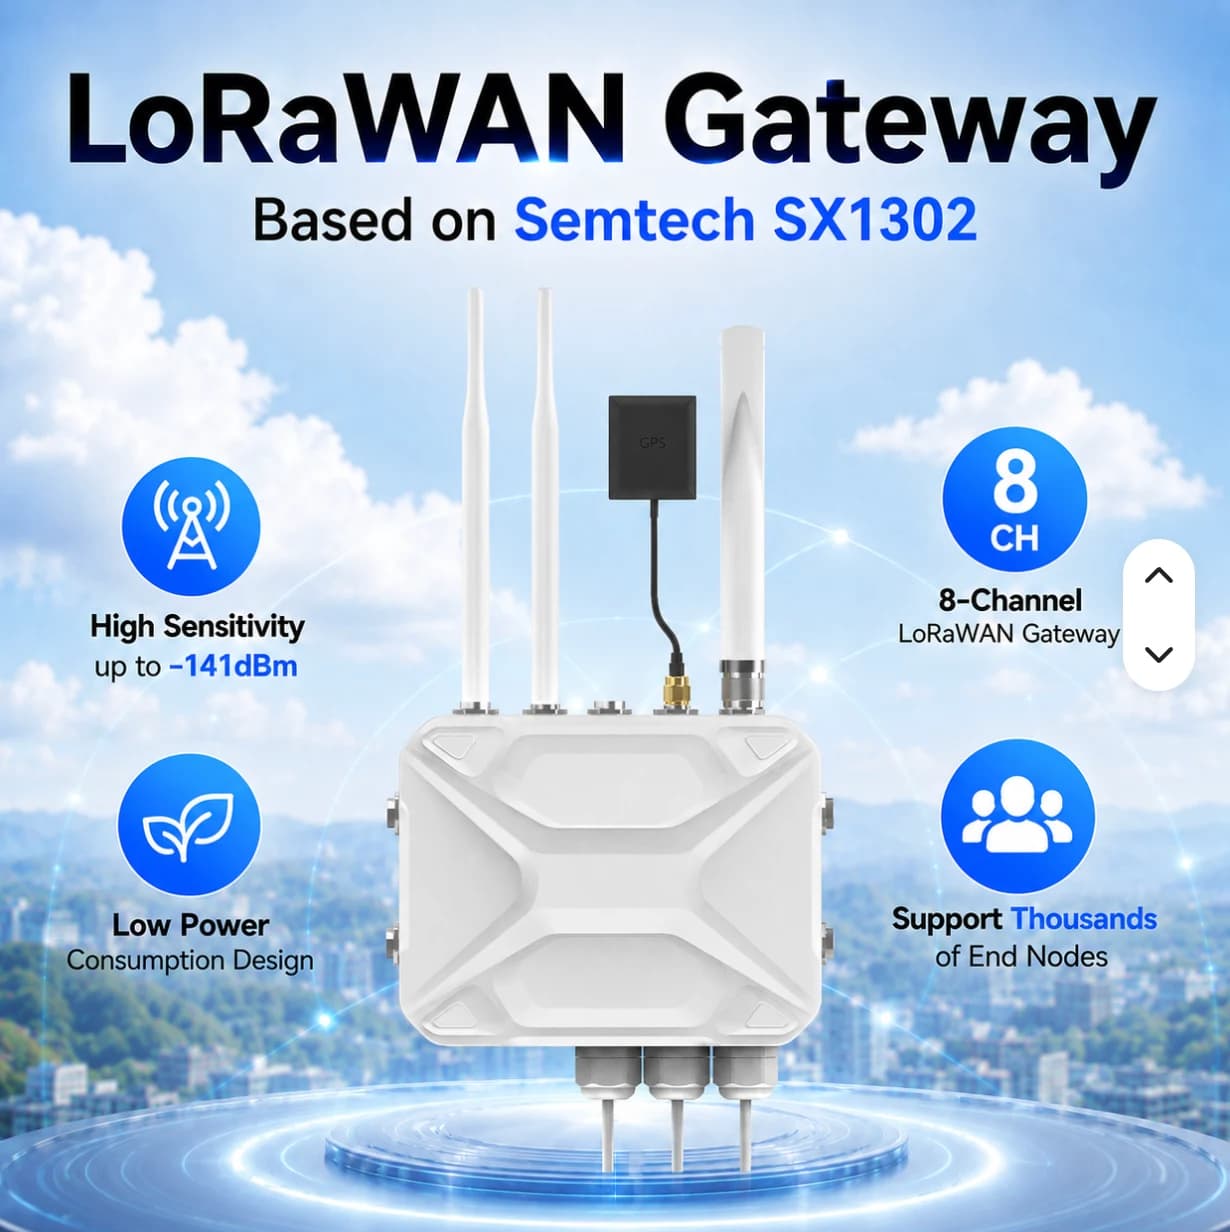
Supplier reference for outdoor LoRaWAN gateway with antennas and GPS

02 / WIRELESS / OUTDOOR

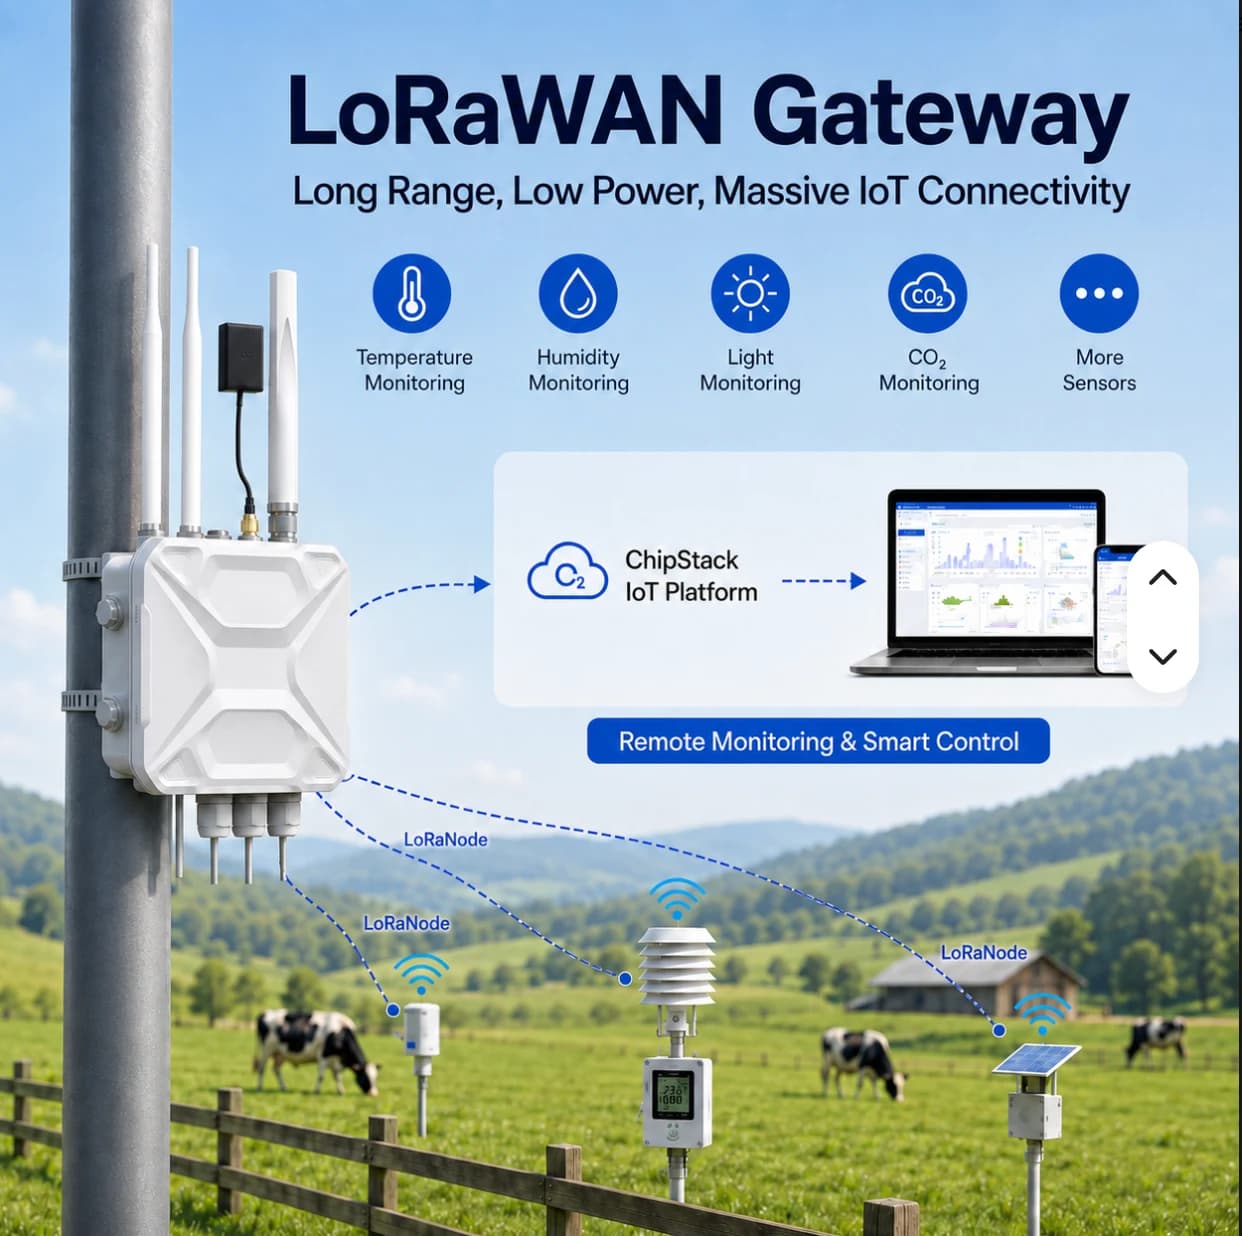
Outdoor LoRaWAN Gateway

Aggregate LoRaWAN sensor data across outdoor sites. A pole-mounted enclosure for agriculture, buildings and utilities.

Chipset
Semtech SX1302
Channels
8-channel LoRaWAN
Enclosure
IP67 · Outdoor
Development
Node-RED · Python

For distributed sensors and sites where cabling is difficult.

Confirm the selected frequency variant, network server and platform integration for each project.

Product and installation detailsEnquire about this product

Details are based on supplier reference images. Confirm the model, specifications, included accessories and AIoT TH Cloud integration before quotation.

AIoT Gateway

Details and scope

Install at a control cabinet or signal collection point to gather device readings and forward them to AIoT TH Cloud. Select the data points and connection method around the equipment at each site.

Field devices
PLCs, power meters and sensors supporting the protocols agreed for the project
Data acquisition
Modbus RTU over RS485, Modbus TCP over Ethernet, and digital inputs
Uplink
Dual-SIM 4G or Internet over LAN, depending on the model and site configuration
Network outages
Designed to buffer data and forward it after reconnecting; a target of at least 24 hours depends on point count and sampling frequency
Configuration
QR gateway registration and cloud-managed configuration
Product range
Industrial 4G LTE Router and Outdoor LoRaWAN Gateway — choose for your site connectivity.

Where it fits

Use the gateway between existing equipment and a monitoring system. Begin with the readings that matter.

  • Energy: read compatible Modbus electricity meters
  • Machines: read status and signals exposed by the PLC or sensors
  • Remote sites: collect supported water-level, pressure or pump-status signals

What to prepare before selecting a model

These details help define the gateway and installation scope.

  • Equipment models and register maps or signal lists
  • Device count, data points and required sampling intervals
  • Interfaces, cable distances, cabinet space and power supply
  • Available cellular coverage or approved site LAN access

Confirm specifications for the selected model

CPU, RAM, storage, port count, supply voltage, temperature range, protection ratings and accessories must be confirmed against the offered model’s datasheet. Platform-level specifications do not replace a model-specific datasheet.

  • Writing control commands and additional protocols require a separately agreed scope
  • Include SIM costs, wiring, installation and PLC changes in the quotation

FACTORY APPLICATIONS

From a site problem to a practical system

Illustrative system designs with equipment, data, responsible teams and project conditions. These are not customer case studies.

DIGITAL TWIN · SIMULATED

Simulated digital twin: site, equipment and events in one view

This simulated digital twin is a model running in your browser. It does not mirror a PLC or customer site and does not control equipment.

Simulated data · No equipment connected
Factory monitoring · 3D DIGITAL TWINDrag to orbit · Scroll or pinch to zoom
Loading 3D map…

Live (simulated) · 08:00:00

Illustrative 3D layout, not surveyed coordinates. Scene labels show values from the simulated twin. Select equipment on the scene or in the twin tree.

Total power62.0 kW
M-02 temperature46.0 °C
M-02 vibration2.10 mm/s

WHAT-IF · SIMULATED

Current plan vs alternative · next 30 simulated minutes

Current plan

M-01 running

Energy over 30 min
31.1 kWh
Peak power
64.7 kW

Alternative

M-01 stopped

Energy over 30 min
17.4 kWh
Peak power
36.2 kW
Total power (kW)

Computed from the browser simulation to compare choices; not a prediction for a real site.

Inspection and command history

Select a scene device, then inspect or control it

Data path

PLC / Meter → Modbus TCP / RS485 → Gateway → MQTT TLS :8883 → Monitor

CCTV uses IP over PoE / NVR independently of LoRaWAN. This scene is illustrative and has no live video.

Operator view

Connect power readings and machine states to site locations for maintenance inspection.

ILLUSTRATIVE SYSTEMUnderstand where and when the factory uses energy
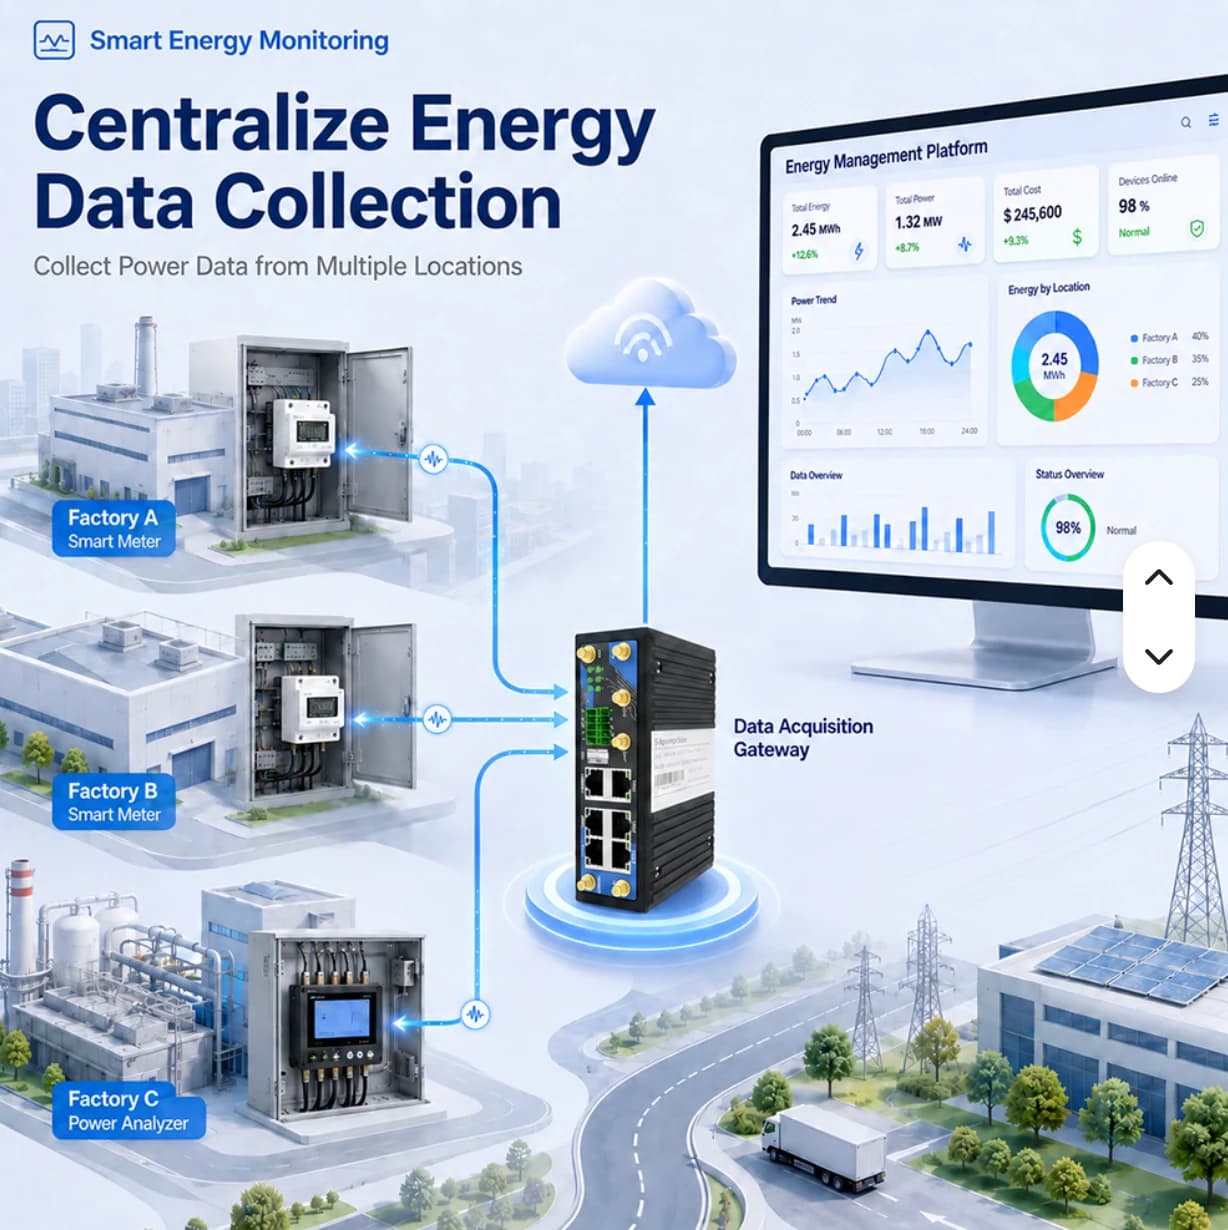
Supplier illustration of energy data collection across factories

Example system: main switchboard, production line and compressed air

Move from a monthly total to area-level meter readings that engineering teams can use to investigate loads and plan improvements.

Suppose a factory wants to monitor three metering points. Start with readings and history for each point. Cost calculations or energy per unit require additional data and agreed formulas; they are not automatically included.

Problems and practical approaches

The monthly bill does not identify high-load areas

Teams investigate several cabinets and may act on the wrong source

Approach · Define main and submeter boundaries, collect readings by point and compare periods with similar production conditions

Manual readings are recorded at different times in separate files

Differences may reflect timing rather than actual load changes

Approach · Read supported meters through a gateway, standardize names, units and timestamps, and compare values with the meter display

An unusual load is discovered only after the shift

The team lacks event-time data to prioritize equipment checks

Approach · Agree site-specific thresholds, enable scoped notifications and assign a person to investigate the equipment

Equipment and components

  • Three compatible meters: main, production line and compressor
  • An industrial gateway with matching interfaces, power and connectivity
  • Cloud points organized by site, area and asset
  • Dashboards, history and notifications within package scope

Data to monitor

  • Power in kW and cumulative energy in kWh
  • Voltage, current and power factor where exposed by the meter
  • Last update time and connectivity status

Data journey

  1. Electricity meters
  2. RS485 / Ethernet
  3. Industrial gateway
  4. AIoT TH Cloud
  5. Dashboard / alerts

Workflow and responsibilities

  1. Define circuit boundaries

    Electrical engineer

    Select comparison points and identify main versus submeter boundaries to avoid double counting

  2. Configure acquisition

    Equipment owner

    Verify registers, units, CT ratios and polling intervals for the actual meter

  3. Validate source readings

    Installer and site team

    Compare the dashboard with the meter at matching times and record discrepancies

  4. Monitor load patterns

    Energy engineer

    Read current values and history alongside operating schedules, not totals alone

  5. Investigate notifications

    Maintenance

    Check equipment and production conditions before deciding on an operational change

  6. Review changes

    Production manager

    Compare similar operating periods and record changes and remaining data gaps

How each factory team benefits

Energy engineering

Identify periods and areas that merit further load investigation

Maintenance

Use timestamped readings when checking notified equipment

Production

Review machine-start schedules and shift changes with supporting data

Management and cost planning

Support improvement proposals with measurements; cost formulas still require separate validation

Who this is suitable for

  • Factories with multiple circuits or buildings that need separate energy readings
  • Engineering teams with readable meters and an owner for source validation
  • Projects starting with critical points before a wider rollout

Acceptance checks

  • Dashboard values match meter units and scaling
  • Stale or missing data and timestamp meaning can be identified
  • Owners can find a known event and test notifications within scope
Discuss your site
ILLUSTRATIVE SYSTEMSee machine states and investigate events with history
Supplier illustration of industrial equipment connected through a gateway

Example system: a packaging line with several stations

Connect PLC or sensor signals so production and maintenance use the same observations before developing performance analytics.

This illustrative line has feeding, filling and packing stations. Start with run/fault states and counters exposed by the PLC. Existing controls are not automatically modified, and an offline gateway is not treated as evidence of a machine stop.

Problems and practical approaches

Staff must walk the floor to see which machines are running

Shift leaders lack a shared view across multiple machines

Approach · Define readable PLC states and display them by machine with update timestamps

Stop records rely on memory or retrospective notes

Investigations begin without reliable times and source signals

Approach · Retain relevant states and readings to identify investigation periods; a person still confirms the actual cause

OEE is requested, but only a run signal is available

A calculated number may not represent production correctly

Approach · Separate acquisition from analytics and define shifts, counts, good units and ideal cycle times before agreeing OEE formulas

Equipment and components

  • PLCs or sensors exposing agreed states
  • A gateway with matching Ethernet, RS485 or digital-input interfaces
  • Cloud assets separated by station
  • Dashboard values and history shared by production and maintenance

Data to monitor

  • Run, stop or fault values defined with the machine owner
  • Production counters, temperature or current where a data source exists
  • Gateway connectivity and update time, separate from machine state

Data journey

  1. PLC / sensor
  2. Readable values or states
  3. Gateway
  4. Cloud assets
  5. Production view

Workflow and responsibilities

  1. Define machine states

    Production and PLC owner

    Agree run, stop and fault meanings, including changeovers and planned stops

  2. Prepare a signal list

    Automation engineer

    Document addresses, types, units and a read method that does not interfere with control

  3. Check actual events

    Installer and operator

    Compare displayed states with machine behavior during an agreed test

  4. Monitor the shift

    Shift leader

    Check states and freshness, using history to select periods for investigation

  5. Investigate on site

    Maintenance

    Inspect the machine and record causes through the factory process rather than assuming them from one signal

  6. Review analytics inputs

    Production engineering

    Validate counts, shifts and formulas before adding downtime or OEE analysis

How each factory team benefits

Shift leaders and production

Coordinate using station-level readings and event timestamps

Maintenance

Use historical signals as evidence rather than relying only on recollection

Automation engineering

Maintain and extend the system using shared point definitions

Factory management

Identify available and missing inputs before investing in performance analytics

Who this is suitable for

  • Factories with readable PLC values or accessible state signals
  • Production and maintenance teams willing to agree state definitions
  • Teams collecting reliable inputs before separately scoped downtime or OEE analytics

Acceptance checks

  • Dashboard states match the agreed machine test cases
  • Machine stops can be distinguished from gateway disconnections
  • Machine owners accept the documented signal definitions
Discuss your site
ILLUSTRATIVE SYSTEMMonitor pumps, tanks and distributed measurement points
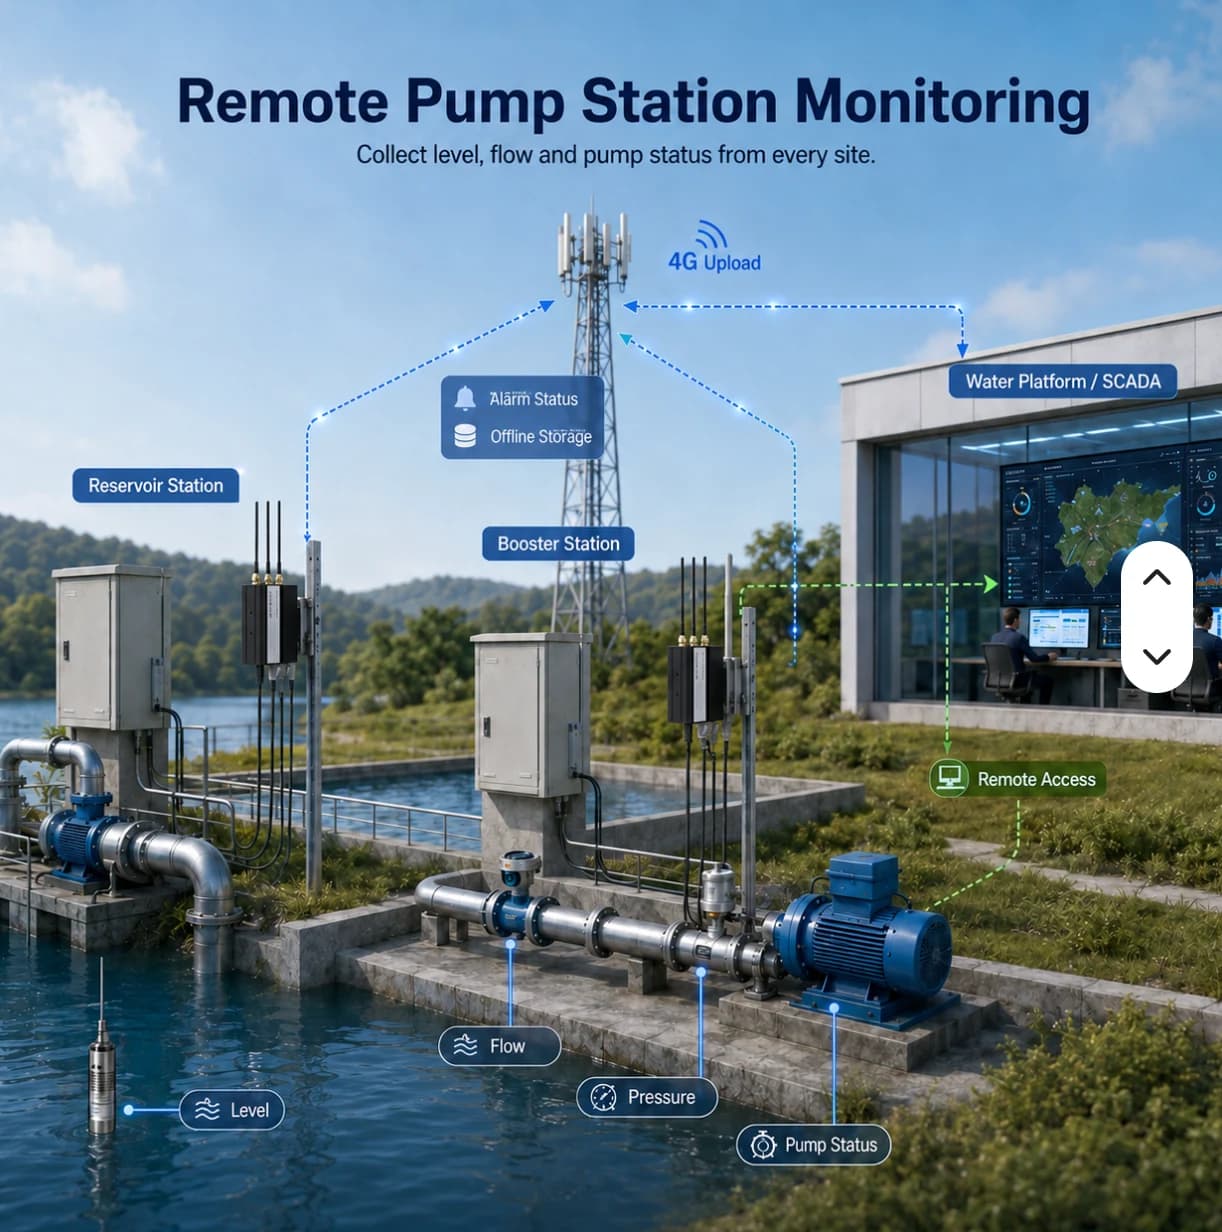
Supplier illustration of remote water-level, flow and pump monitoring

Example system: factory water tanks and pump stations

Give teams the latest readings, update times and connectivity context before deciding which location needs an on-site check.

This illustrative site has a tank and pump stations in separate locations. Wired devices may use an industrial gateway. LoRaWAN sensors need a compatible gateway, network server and payload decoder before data reaches the agreed application.

Problems and practical approaches

Staff travel to each point to check level or pressure

Routine visits take time and may miss events between inspections

Approach · Select suitable sensors and connectivity, group readings by station and retain appropriate physical inspection routines

A value remains visible after the device disconnects

Users may mistake an old reading for the current condition

Approach · Display timestamps and connectivity, distinguishing threshold events from missing data

No one is clearly responsible after an alert

Data exists without an investigation and coordination process

Approach · Assign station owners, recipients and checking procedures, then test them with the actual team

Equipment and components

  • Level, pressure or flow sensors selected for the task
  • A wired gateway or LoRaWAN system suited to the sensor network
  • Site-appropriate power, mounting and uplink equipment
  • Cloud station views with scoped history and notifications

Data to monitor

  • Level, pressure, flow or other values exposed by the equipment
  • The last update time for each point
  • Gateway connectivity and data completeness

Data journey

  1. Sensors / meters
  2. Wired or LoRaWAN + network server
  3. Available site uplink
  4. Cloud stations
  5. Operator review

Workflow and responsibilities

  1. Survey installation points

    Utilities and IT

    Identify stations, power, access, antenna positions and connectivity constraints

  2. Connect sensor readings

    Installer

    Verify interfaces or frequency plans and decode values into correct units

  3. Test continuity

    Site team

    Check actual readings, disconnection and recovery under an approved site test plan

  4. Review values and time

    Station operator

    Read values together with update times; do not treat stale values as current evidence

  5. Notify and inspect

    Incident owner

    Identify the event and coordinate an on-site check; use approved procedures for pump control

  6. Review site maintenance

    Utilities manager

    Use history to support inspection planning and record network or equipment issues

How each factory team benefits

Utilities

Prioritize checks using missing-data and measurement context by station

Maintenance

Prepare site visits with relevant readings and timestamps

IT and networking

Separate sensor acquisition issues from uplink or access problems

Multi-site operators

Coordinate using consistent station names and ownership rather than verbal descriptions alone

Who this is suitable for

  • Factories with distributed tanks, pumps or utility systems
  • Sites where suitable power and a data uplink can be provided
  • Teams with assigned recipients and inspection capacity, without replacing safety controls with cloud monitoring

Acceptance checks

  • Readings and units match the actual measurement point
  • Operators can distinguish stale values during disconnection
  • Alert recipients can identify the station and follow the agreed check procedure
Discuss your site

DETAILS & PLANNING

Check site readiness before selecting hardware

Survey the cabinet and signal path

Allow space for the device, cables and maintenance access. Review the power supply, grounding, cable route and site requirements with the responsible team. An industrial enclosure is not automatically suitable for outdoor exposure; confirm the specific variant and installation environment.

  • Power supply and protection required by the site
  • RS485 route, network access and antenna placement
  • Rated temperature and enclosure protection for the quoted variant

Prepare a traceable point list

Each measurement should identify its device, location, source address, engineering unit and sampling interval. For example, identify the meter providing cumulative energy rather than using a generic Power label. The point list connects gateway configuration to the values shown on the dashboard.

  • Device ID and register or signal channel
  • Data type, byte order and scale factor
  • Acceptance comparison against the device display

Review each system’s scope before opening it or using the example to plan your project.

Questions about this topic

How much data can the gateway retain offline?

Capacity depends on storage, point count and sampling rate. A platform buffering target is not a guaranteed capacity for every hardware model; test the actual configuration.

What PLC information does the installer need?

Provide the PLC model, enabled protocol, read permissions and address/register list with data types. Coordinate with the machine owner to avoid affecting its control program.

Choose hardware and software that work together

Start with your equipment and data points, then define the right site scope.