Current plan
M-01 running
- Energy over 30 min
- 31.1 kWh
- Peak power
- 64.7 kW
Hardware / Outdoor LoRaWAN Gateway
Aggregate LoRaWAN sensor data across outdoor sites. A pole-mounted enclosure for agriculture, buildings and utilities.
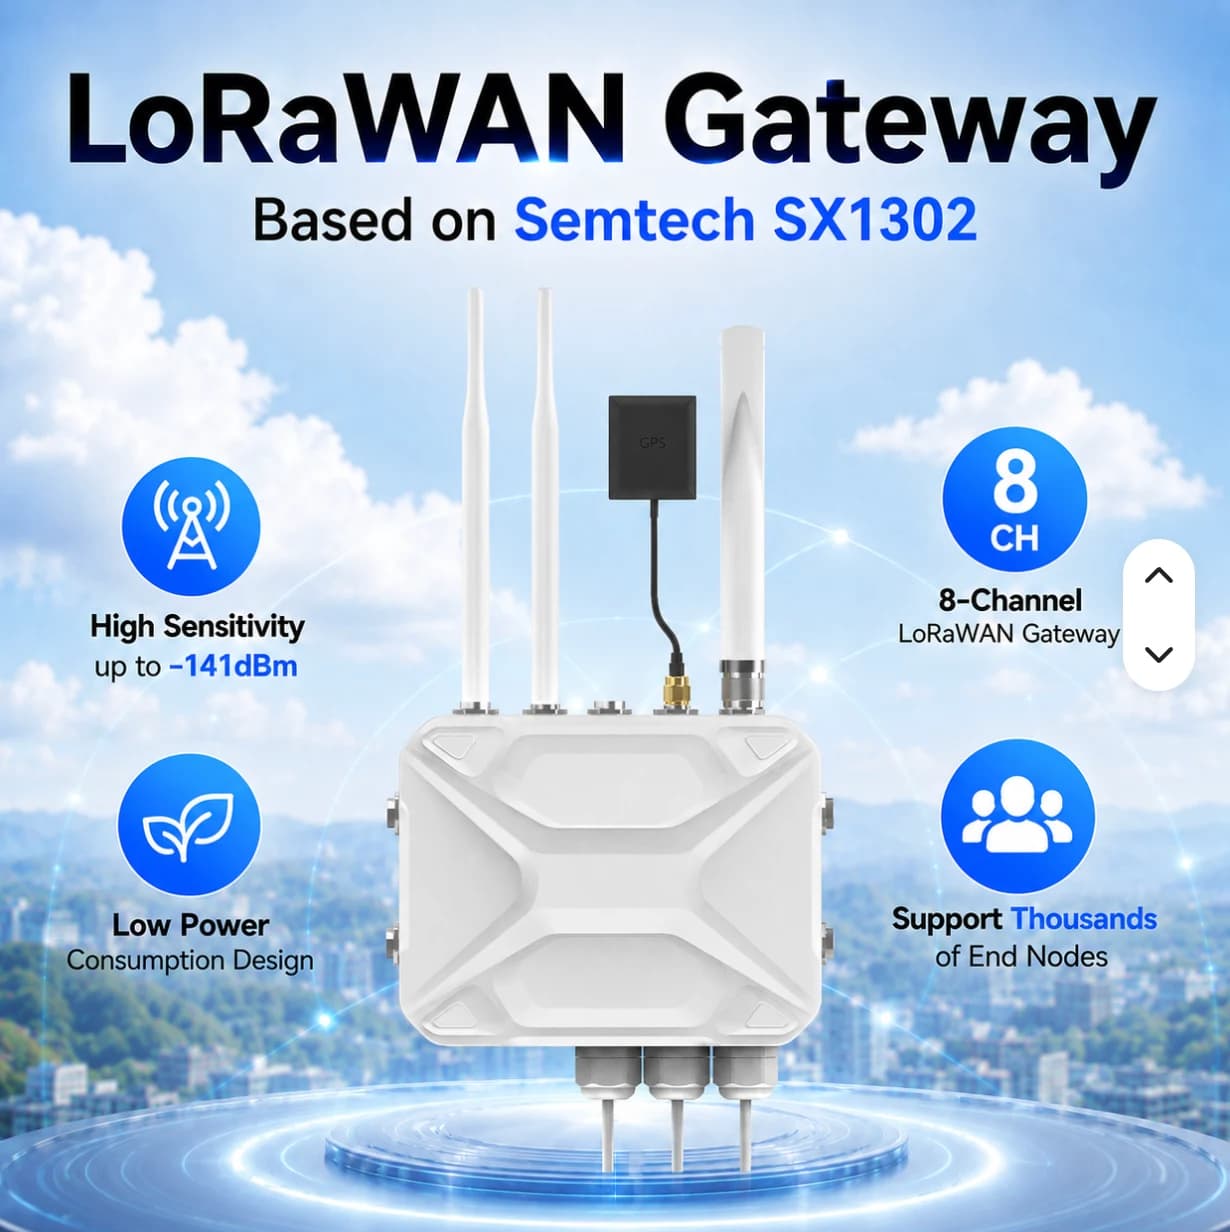
Outdoor LoRaWAN Gateway
Details are based on supplier reference images. Confirm the model, specifications, included accessories and AIoT TH Cloud integration before quotation.
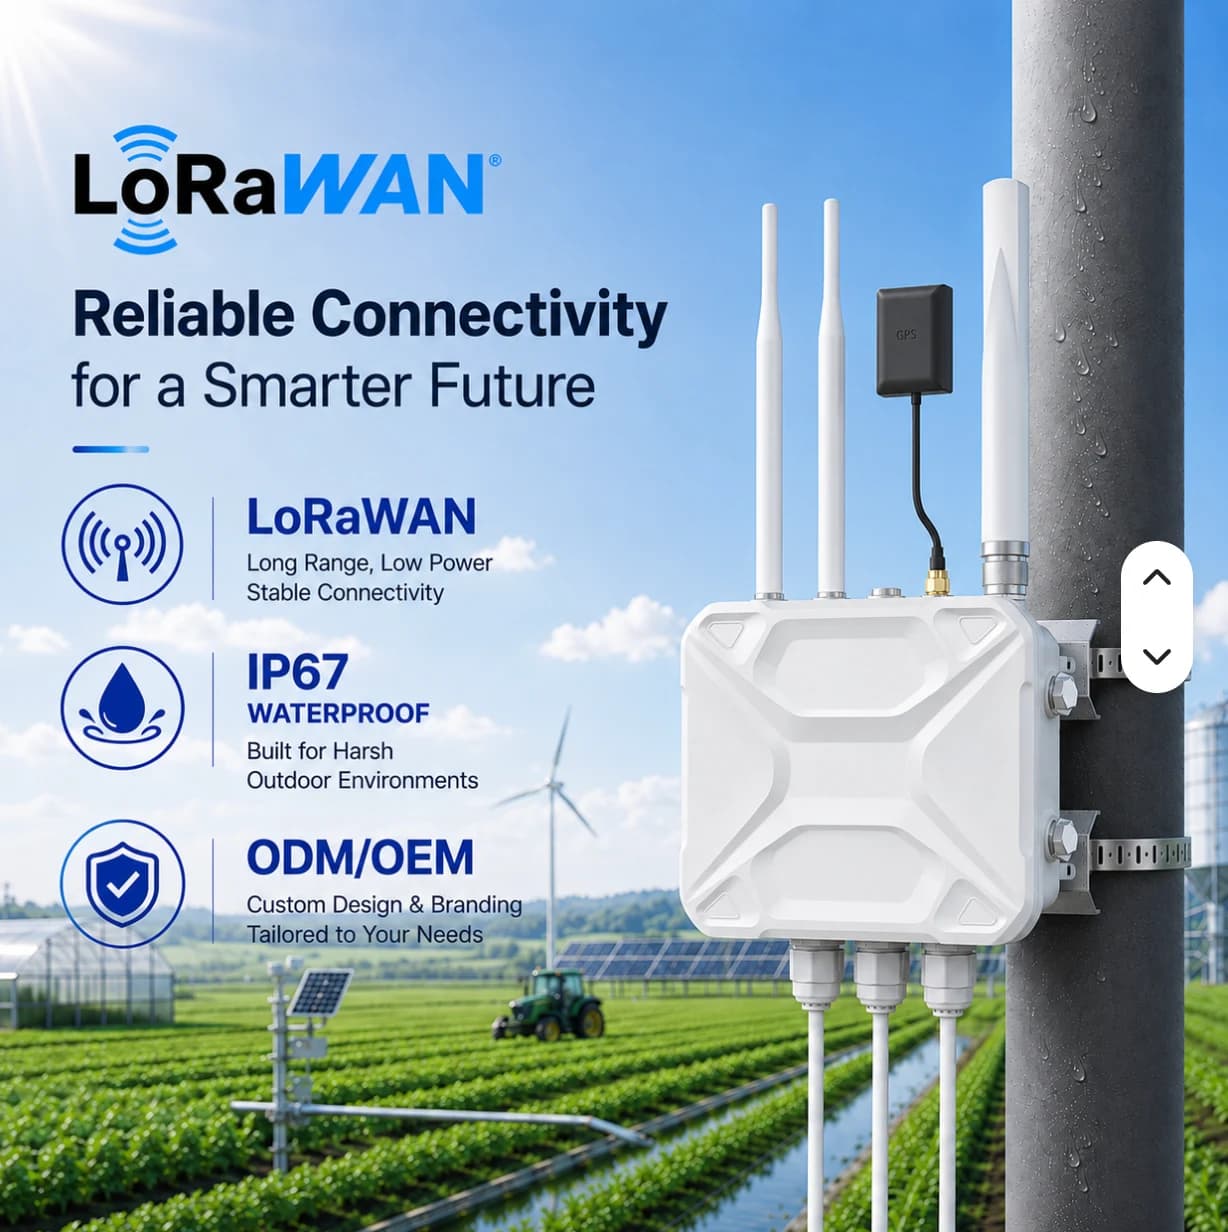
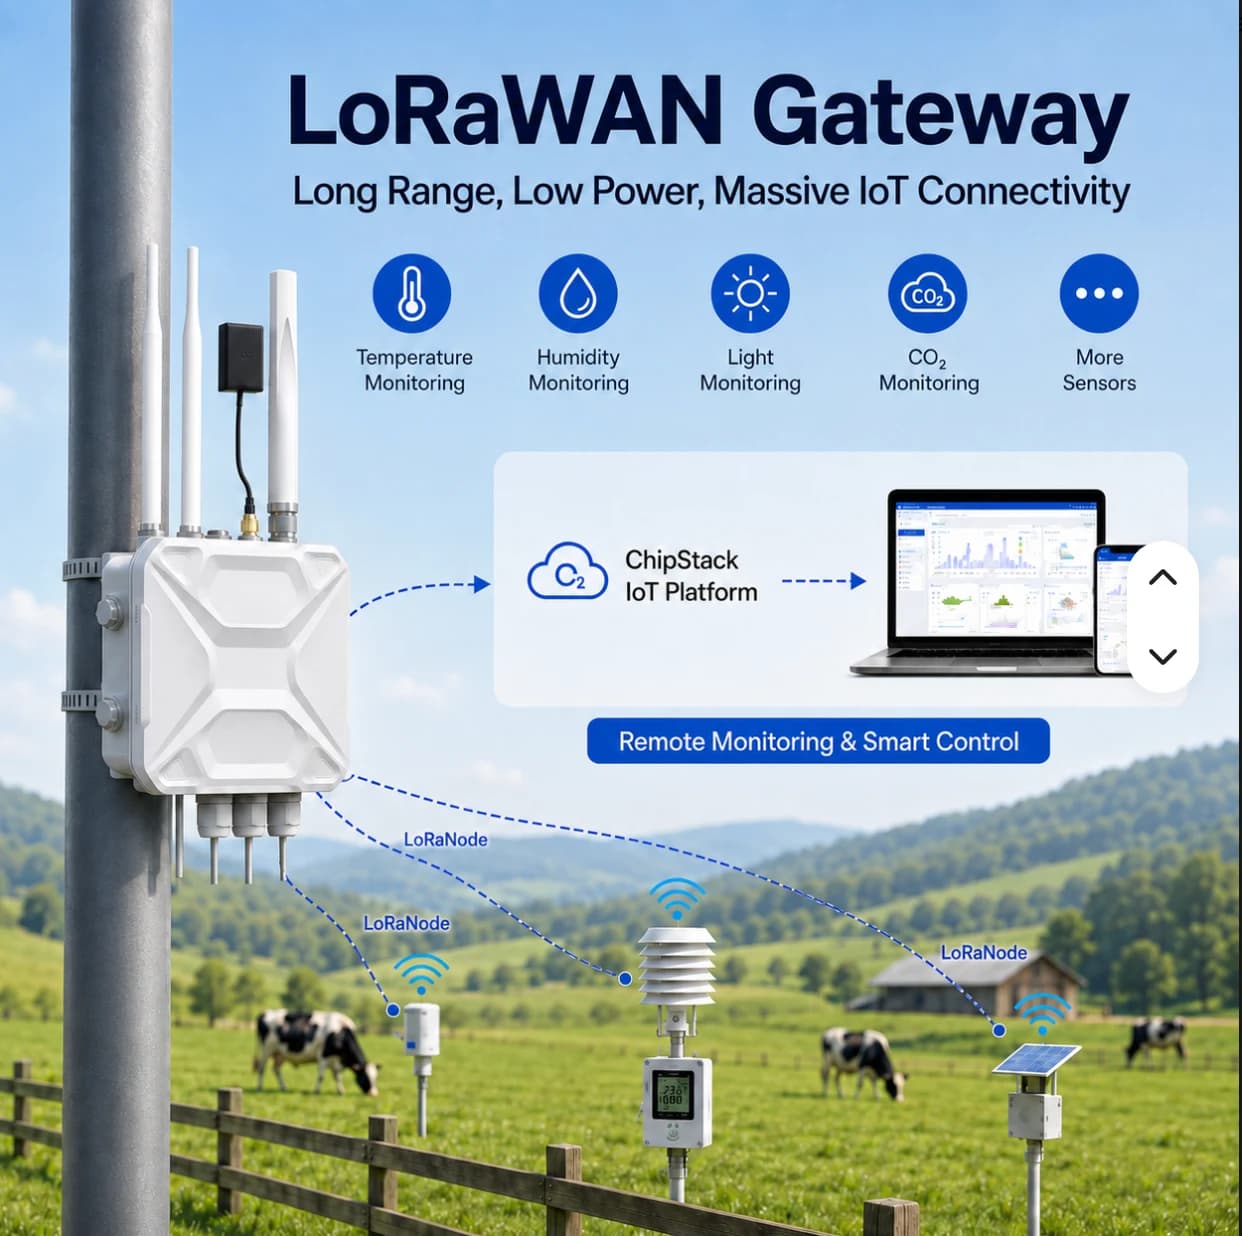
For distributed sensors and sites where cabling is difficult.
Have the site owner confirm power, installation position and networking before selecting accessories.
Confirm the selected frequency variant, network server and platform integration for each project.
FACTORY APPLICATIONS
Illustrative system designs with equipment, data, responsible teams and project conditions. These are not customer case studies.
DIGITAL TWIN · SIMULATED
This simulated digital twin is a model running in your browser. It does not mirror a PLC or customer site and does not control equipment.
Live (simulated) · 08:00:00
Illustrative 3D layout, not surveyed coordinates. Scene labels show values from the simulated twin. Select equipment on the scene or in the twin tree.
WHAT-IF · SIMULATED
M-01 running
M-01 stopped
Computed from the browser simulation to compare choices; not a prediction for a real site.
Select a scene device, then inspect or control it
PLC / Meter → Modbus TCP / RS485 → Gateway → MQTT TLS :8883 → Monitor
CCTV uses IP over PoE / NVR independently of LoRaWAN. This scene is illustrative and has no live video.
Connect power readings and machine states to site locations for maintenance inspection.
Give teams the latest readings, update times and connectivity context before deciding which location needs an on-site check.
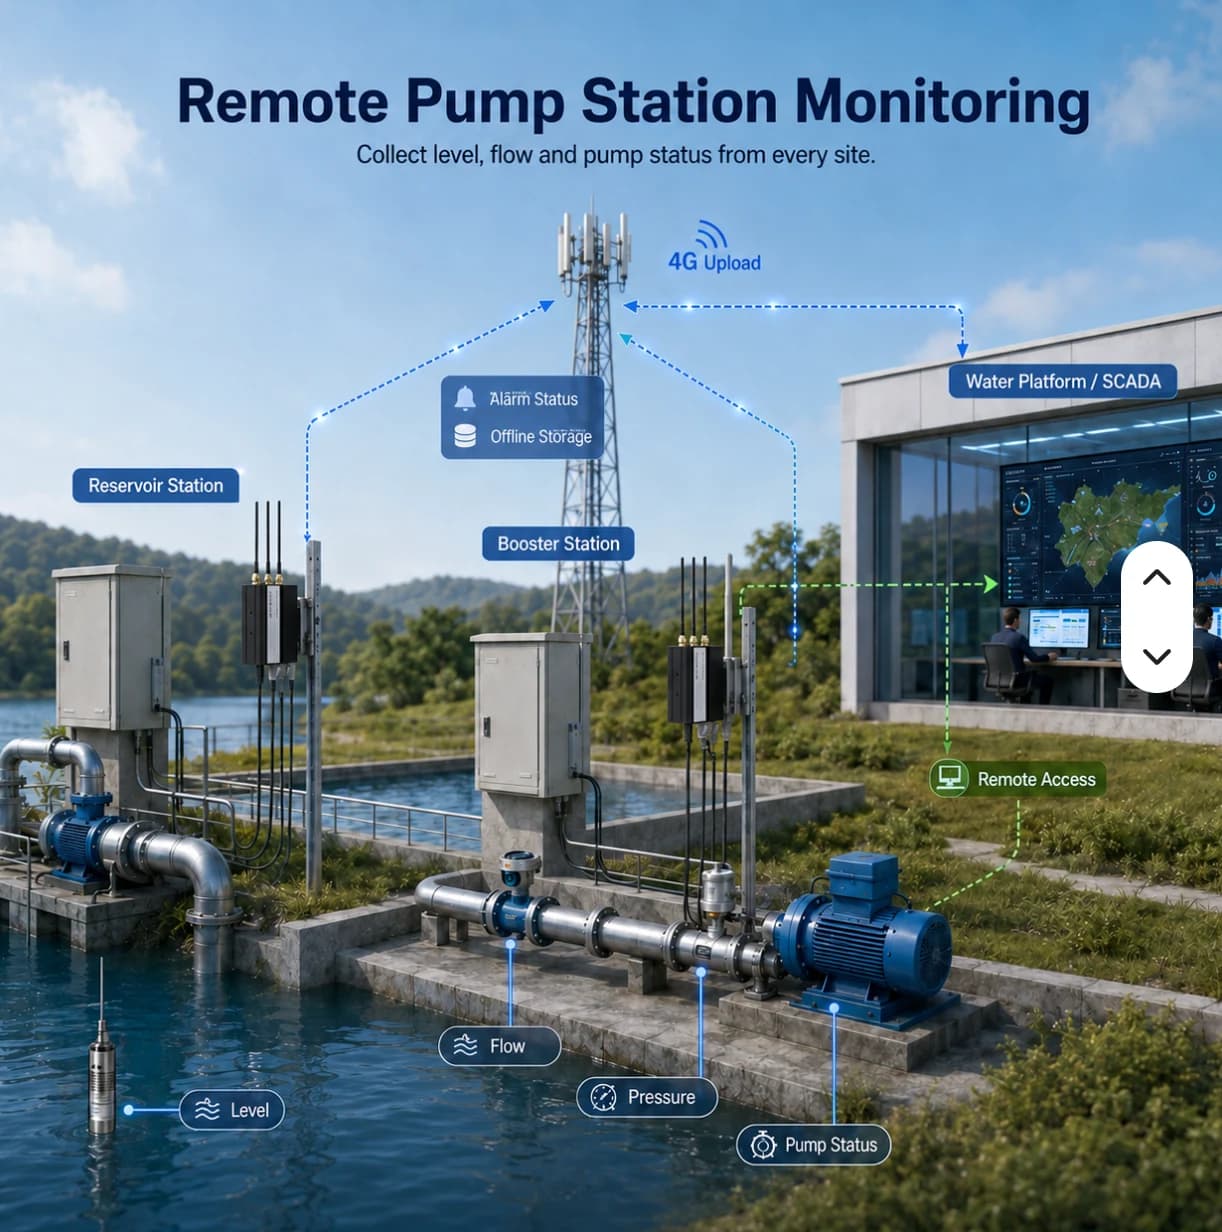
This illustrative site has a tank and pump stations in separate locations. Wired devices may use an industrial gateway. LoRaWAN sensors need a compatible gateway, network server and payload decoder before data reaches the agreed application.
Routine visits take time and may miss events between inspections
Approach · Select suitable sensors and connectivity, group readings by station and retain appropriate physical inspection routines
Users may mistake an old reading for the current condition
Approach · Display timestamps and connectivity, distinguishing threshold events from missing data
Data exists without an investigation and coordination process
Approach · Assign station owners, recipients and checking procedures, then test them with the actual team
Utilities and IT
Identify stations, power, access, antenna positions and connectivity constraints
Installer
Verify interfaces or frequency plans and decode values into correct units
Site team
Check actual readings, disconnection and recovery under an approved site test plan
Station operator
Read values together with update times; do not treat stale values as current evidence
Incident owner
Identify the event and coordinate an on-site check; use approved procedures for pump control
Utilities manager
Use history to support inspection planning and record network or equipment issues
Prioritize checks using missing-data and measurement context by station
Prepare site visits with relevant readings and timestamps
Separate sensor acquisition issues from uplink or access problems
Coordinate using consistent station names and ownership rather than verbal descriptions alone
DETAILS & PLANNING
A deployment also needs sensors using the matching frequency plan, a network server and a decoder that translates payloads into useful units. Images showing many nodes do not guarantee capacity in every environment. Assess reporting intervals and site radio conditions.
The reference image describes an IP67 enclosure. The installation must also account for cable glands, mounting, power and site protection requirements. Survey gateway and antenna placement in the actual area rather than assuming coverage from marketing material.
Review each system’s scope before opening it or using the example to plan your project.
Live public observations · Read-only
View rain, water-level and road-water observations on a station map with timestamps and source attribution.
Demonstration with simulated data
Explore energy, machine monitoring and OEE examples with a 3D factory to understand data and workflows before planning a project.
Do not assume LoRa and LoRaWAN devices are interchangeable. Confirm protocol, frequency plan, provisioning and payload format for each sensor model.
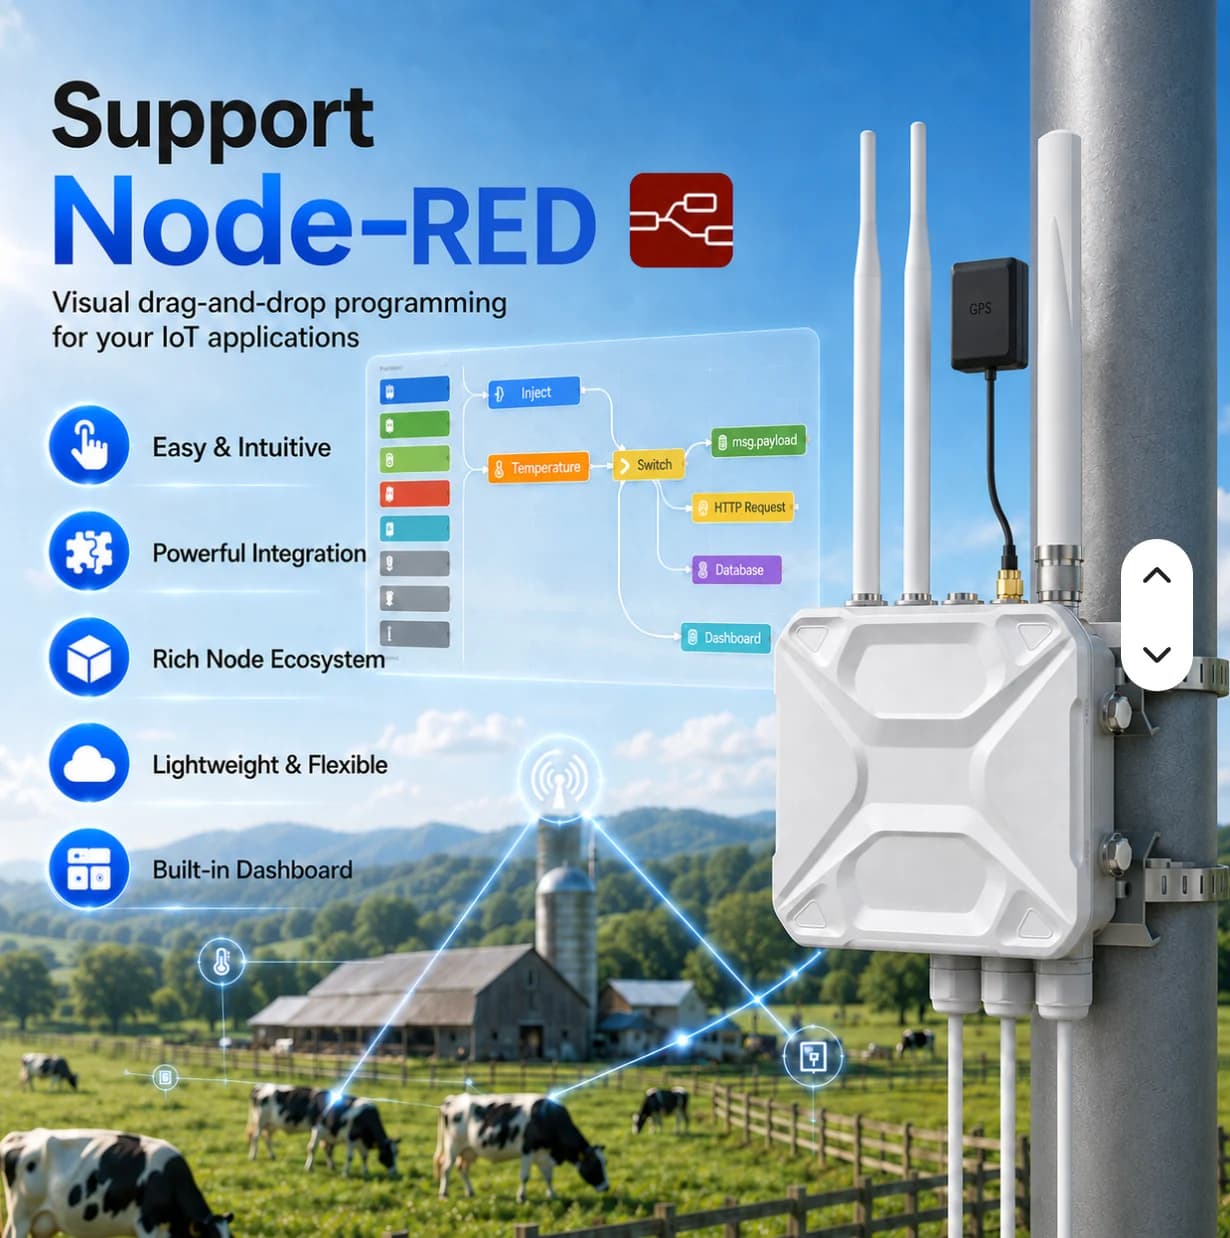
Confirm the firmware and supplier bundle. The images describe reference capabilities; network-server setup and cloud integration must be specified for the project.
Start with your equipment and data points, then define the right site scope.