Current plan
M-01 running
- Energy over 30 min
- 31.1 kWh
- Peak power
- 64.7 kW
Software / AIoT TH Cloud
Factory monitoring with dashboards, history and alerts, plus project-scoped SCADA, factory control and OEE integration.
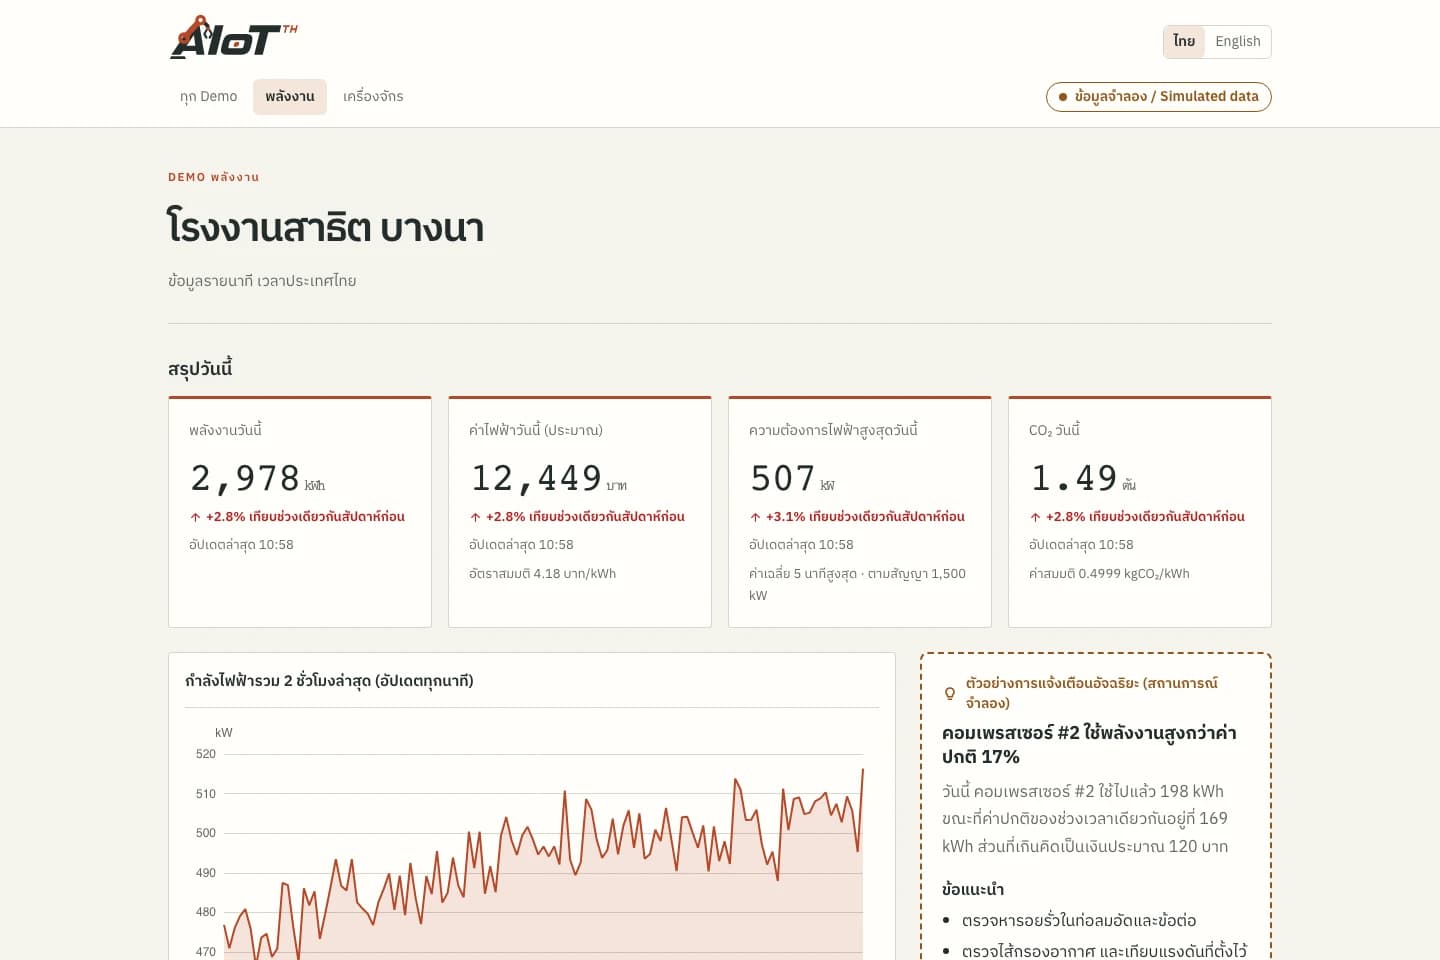
AIoT TH Cloud
Group measurements by area or asset and choose what your team needs to follow on a dashboard. Available capabilities and quotas depend on the package assigned to each site.
Prepare the data before building a dashboard so each reading has a clear meaning.
The current offer retains detailed data for 30 days. Aggregated history, additional retention and point quotas depend on the package. Confirm the quotation before starting a project.
External APIs, advanced dashboards, flows and AI insights are on the roadmap; they are not all currently available.
FACTORY APPLICATIONS
Illustrative system designs with equipment, data, responsible teams and project conditions. These are not customer case studies.
DIGITAL TWIN · SIMULATED
This simulated digital twin is a model running in your browser. It does not mirror a PLC or customer site and does not control equipment.
Live (simulated) · 08:00:00
Illustrative 3D layout, not surveyed coordinates. Scene labels show values from the simulated twin. Select equipment on the scene or in the twin tree.
WHAT-IF · SIMULATED
M-01 running
M-01 stopped
Computed from the browser simulation to compare choices; not a prediction for a real site.
Select a scene device, then inspect or control it
PLC / Meter → Modbus TCP / RS485 → Gateway → MQTT TLS :8883 → Monitor
CCTV uses IP over PoE / NVR independently of LoRaWAN. This scene is illustrative and has no live video.
Connect power readings and machine states to site locations for maintenance inspection.
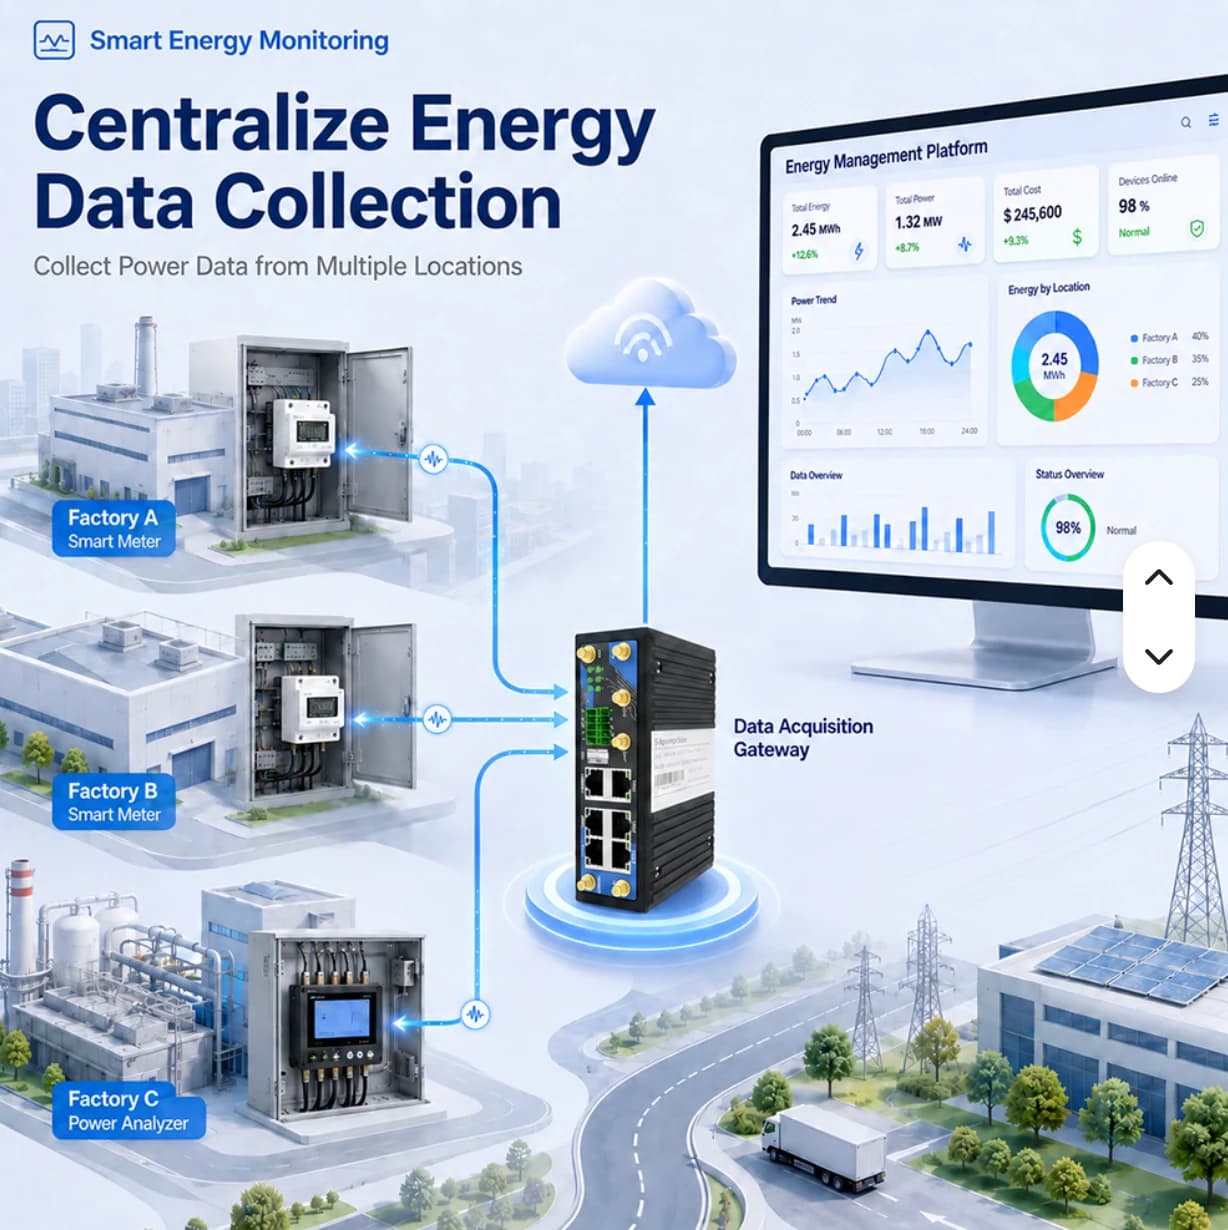
Move from a monthly total to area-level meter readings that engineering teams can use to investigate loads and plan improvements.
Suppose a factory wants to monitor three metering points. Start with readings and history for each point. Cost calculations or energy per unit require additional data and agreed formulas; they are not automatically included.
Teams investigate several cabinets and may act on the wrong source
Approach · Define main and submeter boundaries, collect readings by point and compare periods with similar production conditions
Differences may reflect timing rather than actual load changes
Approach · Read supported meters through a gateway, standardize names, units and timestamps, and compare values with the meter display
The team lacks event-time data to prioritize equipment checks
Approach · Agree site-specific thresholds, enable scoped notifications and assign a person to investigate the equipment
Electrical engineer
Select comparison points and identify main versus submeter boundaries to avoid double counting
Equipment owner
Verify registers, units, CT ratios and polling intervals for the actual meter
Installer and site team
Compare the dashboard with the meter at matching times and record discrepancies
Energy engineer
Read current values and history alongside operating schedules, not totals alone
Maintenance
Check equipment and production conditions before deciding on an operational change
Production manager
Compare similar operating periods and record changes and remaining data gaps
Identify periods and areas that merit further load investigation
Use timestamped readings when checking notified equipment
Review machine-start schedules and shift changes with supporting data
Support improvement proposals with measurements; cost formulas still require separate validation
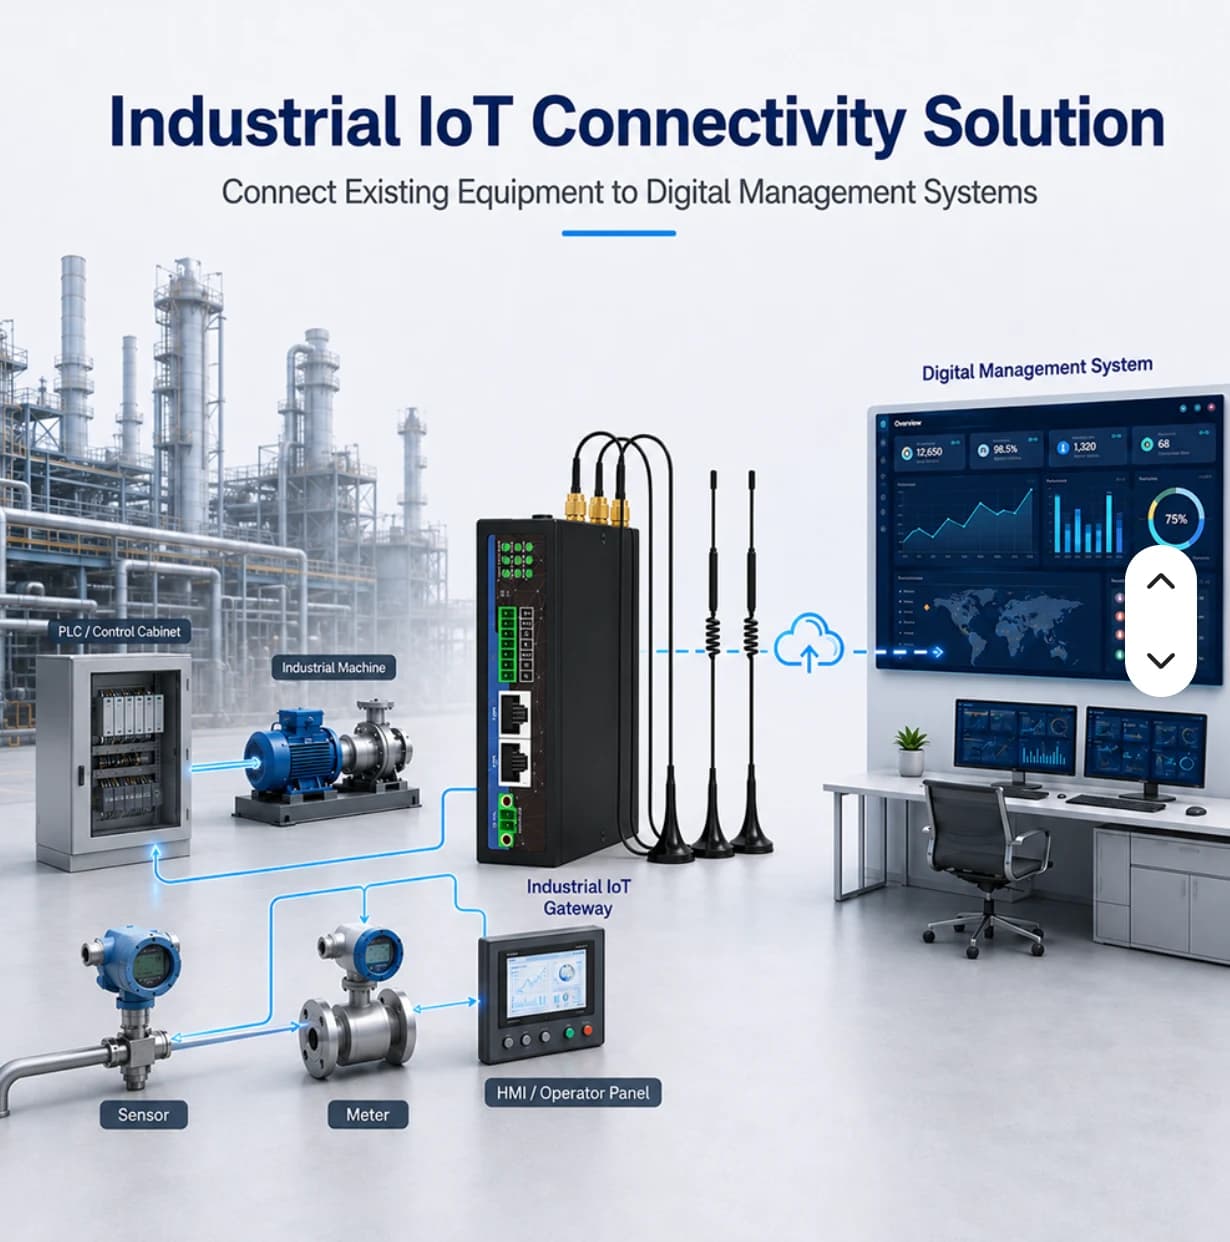
Connect PLC or sensor signals so production and maintenance use the same observations before developing performance analytics.
This illustrative line has feeding, filling and packing stations. Start with run/fault states and counters exposed by the PLC. Existing controls are not automatically modified, and an offline gateway is not treated as evidence of a machine stop.
Shift leaders lack a shared view across multiple machines
Approach · Define readable PLC states and display them by machine with update timestamps
Investigations begin without reliable times and source signals
Approach · Retain relevant states and readings to identify investigation periods; a person still confirms the actual cause
A calculated number may not represent production correctly
Approach · Separate acquisition from analytics and define shifts, counts, good units and ideal cycle times before agreeing OEE formulas
Production and PLC owner
Agree run, stop and fault meanings, including changeovers and planned stops
Automation engineer
Document addresses, types, units and a read method that does not interfere with control
Installer and operator
Compare displayed states with machine behavior during an agreed test
Shift leader
Check states and freshness, using history to select periods for investigation
Maintenance
Inspect the machine and record causes through the factory process rather than assuming them from one signal
Production engineering
Validate counts, shifts and formulas before adding downtime or OEE analysis
Coordinate using station-level readings and event timestamps
Use historical signals as evidence rather than relying only on recollection
Maintain and extend the system using shared point definitions
Identify available and missing inputs before investing in performance analytics
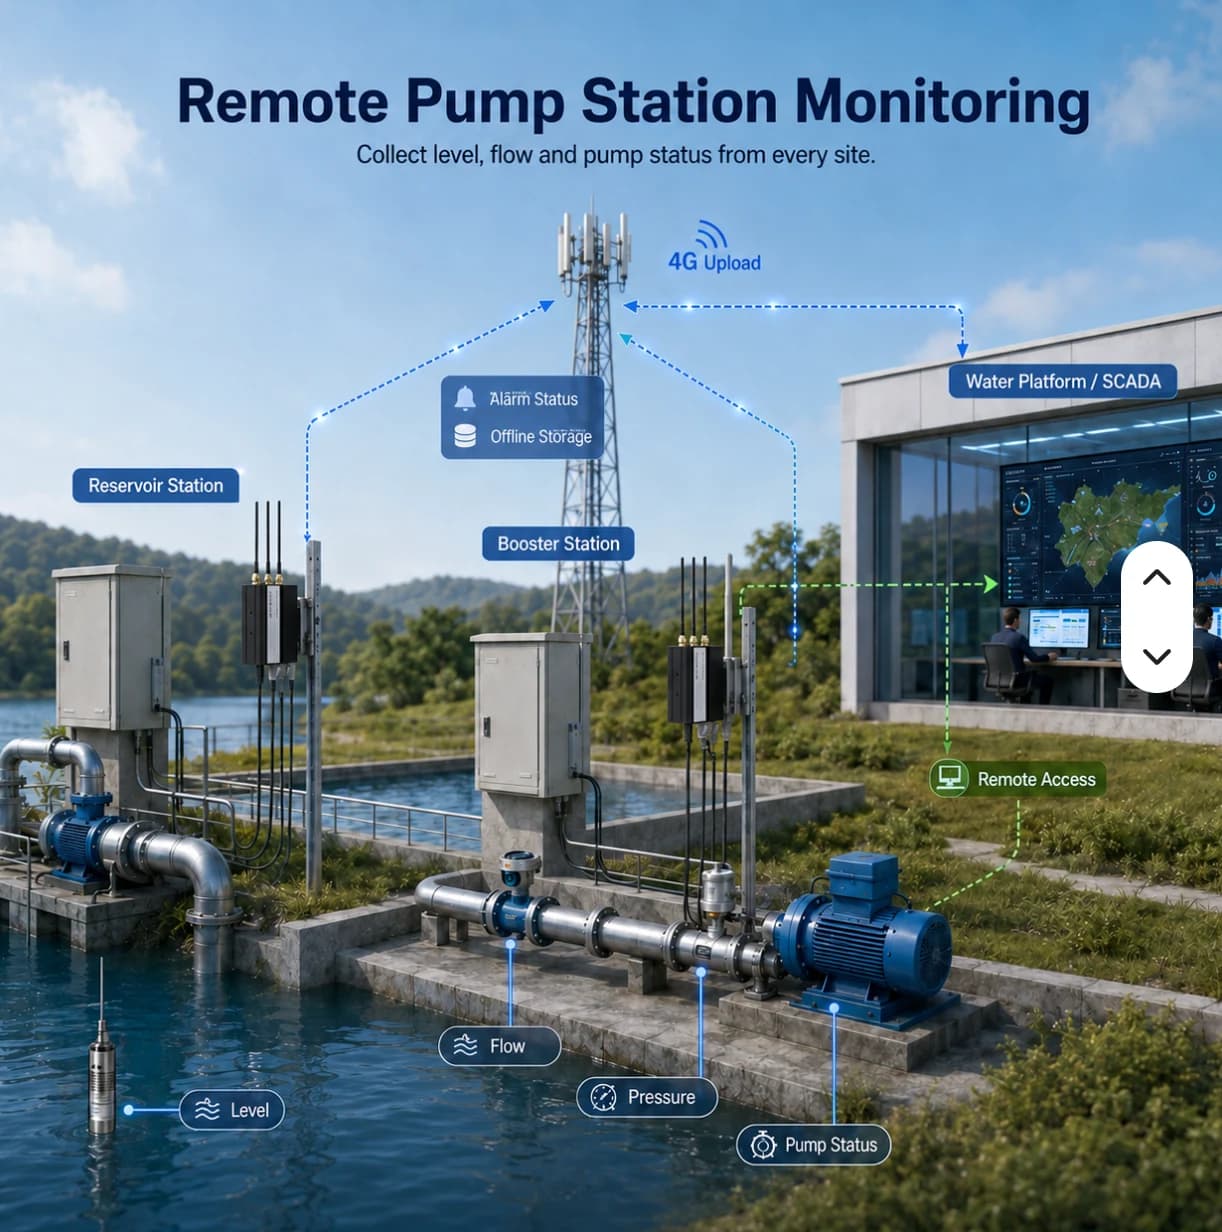
Give teams the latest readings, update times and connectivity context before deciding which location needs an on-site check.
This illustrative site has a tank and pump stations in separate locations. Wired devices may use an industrial gateway. LoRaWAN sensors need a compatible gateway, network server and payload decoder before data reaches the agreed application.
Routine visits take time and may miss events between inspections
Approach · Select suitable sensors and connectivity, group readings by station and retain appropriate physical inspection routines
Users may mistake an old reading for the current condition
Approach · Display timestamps and connectivity, distinguishing threshold events from missing data
Data exists without an investigation and coordination process
Approach · Assign station owners, recipients and checking procedures, then test them with the actual team
Utilities and IT
Identify stations, power, access, antenna positions and connectivity constraints
Installer
Verify interfaces or frequency plans and decode values into correct units
Site team
Check actual readings, disconnection and recovery under an approved site test plan
Station operator
Read values together with update times; do not treat stale values as current evidence
Incident owner
Identify the event and coordinate an on-site check; use approved procedures for pump control
Utilities manager
Use history to support inspection planning and record network or equipment issues
Prioritize checks using missing-data and measurement context by station
Prepare site visits with relevant readings and timestamps
Separate sensor acquisition issues from uplink or access problems
Coordinate using consistent station names and ownership rather than verbal descriptions alone
DETAILS & PLANNING
Align sites, areas and assets with operational responsibilities. Use consistent point names and engineering units so that teams can interpret charts from different machines without relearning the naming scheme. Review the structure before importing a large number of measurements.
Every threshold should have an operational reason, a responsible recipient and a verification procedure. A value exceeding its limit is different from a disconnected device. Consider sampling intervals and network behavior when defining conditions to reduce unnecessary notifications.
Review each system’s scope before opening it or using the example to plan your project.
Organization platform · Sign-in required
Sign in to manage organization sites, devices, data points and packages. Confirm access rights and feature availability before operational use.
Demonstration with simulated data
Explore energy, machine monitoring and OEE examples with a 3D factory to understand data and workflows before planning a project.
Phase 1 focuses on reading and monitoring data. Control commands need additional design and scope; a dashboard should not replace site safety controls.
No. Each site selects a package for its gateway count, points and features. One site’s entitlements do not automatically extend to data from every other site.
Start with your equipment and data points, then define the right site scope.