Current plan
M-01 running
- Energy over 30 min
- 31.1 kWh
- Peak power
- 64.7 kW
Remote Monitoring
Pump stations, tanks or control cabinets spread across many locations send PLC and sensor values over 4G to one cloud, and you are alerted when any site goes offline.
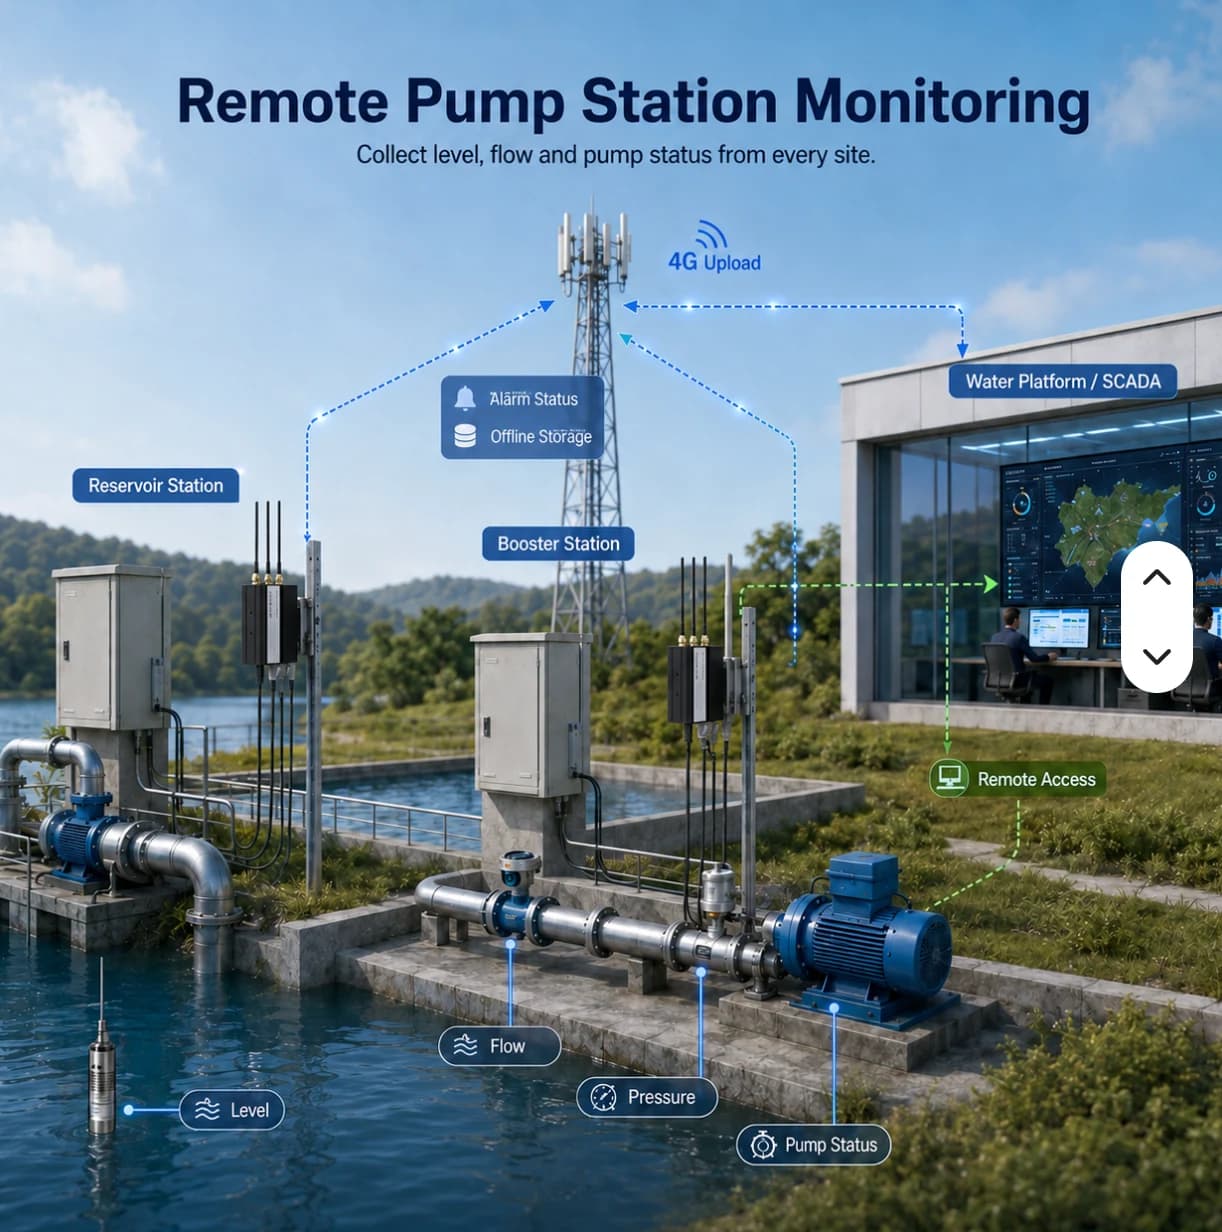
Read through the gateway, shown on the dashboard, with history charts.
From shop-floor equipment to dashboards and alerts.
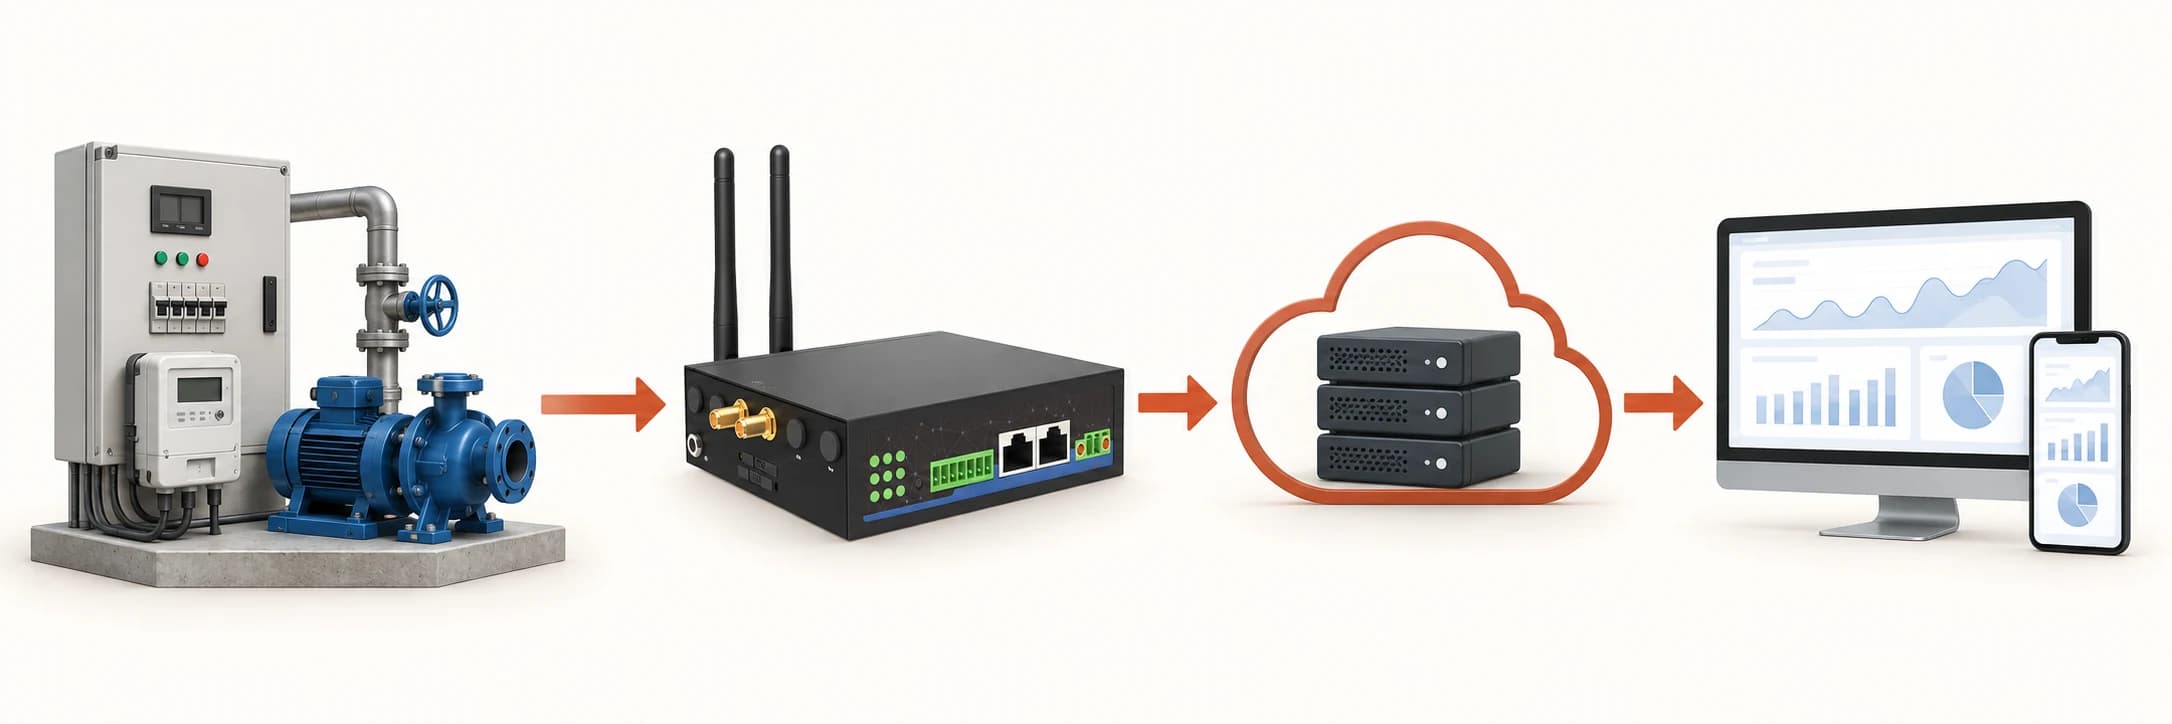
Scroll to explore the connection path →
At pump stations, tanks or cabinets
Wired to your existing equipment
Reads values; buffers when the connection drops
Dual SIM or site LAN, encrypted with TLS
Time-series storage, isolated per organization
On the web; alerts via LINE and email
Available as soon as the gateway is installed.
Latest values and charts for every data point, on desktop and mobile.
Detailed data for 30 days on every package; longer history is kept as summarised data, by package.
Set a high / low limit per data point. When a value goes out of range, you are alerted via LINE and email.
Get alerted when a gateway or device stops sending data — no need to wait for someone to notice.
AI capabilities are on our roadmap. They are not available yet.
Example: a daily report summarising the status of every site.
FACTORY APPLICATIONS
Illustrative system designs with equipment, data, responsible teams and project conditions. These are not customer case studies.
DIGITAL TWIN · SIMULATED
This simulated digital twin is a model running in your browser. It does not mirror a PLC or customer site and does not control equipment.
Live (simulated) · 08:00:00
Illustrative 3D layout, not surveyed coordinates. Scene labels show values from the simulated twin. Select equipment on the scene or in the twin tree.
WHAT-IF · SIMULATED
M-01 running
M-01 stopped
Computed from the browser simulation to compare choices; not a prediction for a real site.
Select a scene device, then inspect or control it
PLC / Meter → Modbus TCP / RS485 → Gateway → MQTT TLS :8883 → Monitor
CCTV uses IP over PoE / NVR independently of LoRaWAN. This scene is illustrative and has no live video.
Connect power readings and machine states to site locations for maintenance inspection.
Give teams the latest readings, update times and connectivity context before deciding which location needs an on-site check.
This illustrative site has a tank and pump stations in separate locations. Wired devices may use an industrial gateway. LoRaWAN sensors need a compatible gateway, network server and payload decoder before data reaches the agreed application.
Routine visits take time and may miss events between inspections
Approach · Select suitable sensors and connectivity, group readings by station and retain appropriate physical inspection routines
Users may mistake an old reading for the current condition
Approach · Display timestamps and connectivity, distinguishing threshold events from missing data
Data exists without an investigation and coordination process
Approach · Assign station owners, recipients and checking procedures, then test them with the actual team
Utilities and IT
Identify stations, power, access, antenna positions and connectivity constraints
Installer
Verify interfaces or frequency plans and decode values into correct units
Site team
Check actual readings, disconnection and recovery under an approved site test plan
Station operator
Read values together with update times; do not treat stale values as current evidence
Incident owner
Identify the event and coordinate an on-site check; use approved procedures for pump control
Utilities manager
Use history to support inspection planning and record network or equipment issues
Prioritize checks using missing-data and measurement context by station
Prepare site visits with relevant readings and timestamps
Separate sensor acquisition issues from uplink or access problems
Coordinate using consistent station names and ownership rather than verbal descriptions alone
DETAILS & PLANNING
LoRaWAN collects packets from local sensors, while 4G or Ethernet can carry data onward to the destination system. Review both links, including the network server and sensor payload decoder. A LoRaWAN label does not mean every sensor integrates with the cloud automatically.
A stale level or pressure value should not be treated as a current reading. Check the last update time together with connectivity. Assign ownership for both disconnected devices and threshold events, since their investigation procedures may differ.
Use LoRa / LoRaWAN for distributed sensors and forward data through a gateway over 4G or LAN. Confirm frequency variant and payload decoding, and validate reception at the intended installation points.
Review each system’s scope before opening it or using the example to plan your project.
Live public observations · Read-only
View rain, water-level and road-water observations on a station map with timestamps and source attribution.
Demonstration with simulated data
Explore energy, machine monitoring and OEE examples with a 3D factory to understand data and workflows before planning a project.
Do not infer a guaranteed range from marketing images. Antennas, height, obstructions, interference and configuration affect coverage; test at the intended site.
The current scope focuses on monitoring. Pump control needs a separate design covering authorization, interlocks and site requirements.
The demo uses simulated data from a sample plant. Our team can assess your actual equipment and site.